
Part 1: Macroeconomic Conditions and Overall Banking Performance
Kenya’s banking sector demonstrated remarkable resilience against a complex macroeconomic backdrop characterized by moderating global inflation, localized economic shocks, and tight monetary conditions. Against this environment, the domestic economy maintained a steady growth trajectory, providing a stable foundation for financial intermediation.
Balance Sheet Expansion and Profitability Dynamics
The sector’s aggregate balance sheet expanded substantially, driven by strategic adjustments in asset allocation and cautious credit extension by commercial banks:
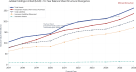
Total Net Assets: Grew by 10.3%, pushing the sector’s aggregate balance sheet to Ksh 8.35 trillion.
Customer Deposits: Surged by 11.6% to reach Ksh 6.12 trillion, underscoring sustained public trust and aggressive deposit mobilization strategies by institutions.
Profitability: Pre-tax profits registered an impressive 17.7% growth to close at Ksh 306.3 billion, largely supported by operational cost rationalization, diversified non-funded income streams, and efficient management of interest margins.
Asset growth was primarily channeled into investments in government securities (which grew significantly by 18.2%) as banks favored low-risk sovereign instruments, alongside a more moderate 6.6% expansion in net loans and advances.
Deposit Account Dynamics, Distribution, and Account Balances
Aggregate Deposit Growth: Total customer deposits across the banking sector surged by 11.6% to reach Ksh 6.12 trillion, underpinned by robust deposit mobilization and sustained public confidence in formal financial institutions.
Tier Concentration & Market Distribution: Deposit distribution remained heavily skewed toward Tier 1 institutions, with major lenders like KCB Bank Kenya (holding Ksh 1.15 trillion in deposits) and Equity Bank Kenya (Ksh 849.2 billion) controlling the vast majority of total sector liquidity.
Account Volume Scaling: Driven by intensive digital channel expansion and mobile-linked banking products (such as those spearheaded by NCBA Bank), total deposit accounts across the sector expanded sharply, scaling into tens of millions of active accounts.
Average Account Balances by Segment: While aggregate deposit volumes expanded into trillions of shillings, the average amounts held per customer account diverged sharply by tier:
Retail & Mass-Market Accounts: Continued to hold smaller average balances, primarily utilized for day-to-day transactional liquidity and micro-savings.
Institutional & Corporate Accounts: Accounted for the lion’s share of absolute value growth, reflecting concentrated corporate liquidity and high-net-worth placements.
Asset Quality and NPL Remediation
Managing credit risk remained a primary focus for institutions as legacy non-performing loans (NPLs) continued to weigh on portfolios:
The absolute stock of NPLs hovered at Ksh 696.9 billion.
However, due to rigorous loan recoveries, aggressive restructuring, and selective credit expansion, the aggregate gross NPL-to-gross loans ratio improved, dropping from 17.1% to 16.0%.
Credit risk concentrations remained highest in traditional sectors such as trade, manufacturing, and personal/household loans, prompting tighter underwriting standards.
Capital Adequacy and Liquidity Buffers
The sector maintained robust capital and liquidity cushions well above statutory floors, insulating institutions against unexpected shocks:
Capital Adequacy Ratio: Stood strong at an average of 20.7%, comfortably surpassing the statutory minimum requirement of 14.5%.
Liquidity Ratio: Averaged 59.3% against the statutory minimum threshold of 20%, reflecting high levels of liquid assets held across institutions to meet short-term obligations.
Part 2: Movement in Regulatory Reform, Supervisory Frameworks & Compliance
The Central Bank of Kenya (CBK) advanced several key structural and regulatory measures aimed at enhancing financial stability, consumer transparency, and risk management across commercial banks, while enforcing stricter supervisory scrutiny.
Risk-Based Credit Pricing Model (RBCPM) Overhaul
The banking sector underwent a monumental shift in loan pricing following the implementation of the revised Risk-Based Credit Pricing Model:
The New Benchmark: The framework replaced the Central Bank Rate (CBR) with the Kenya Shilling Overnight Interbank Average Rate (KESONIA) as the primary reference point for all variable-rate Kenya Shilling-denominated loans. Total lending rates are calculated as KESONIA + Premium (”K”), with the premium accounting for operational costs, shareholder return, and customer-specific risk profiles.
Pricing Enforcement: Targeted CBK inspections revealed widespread adjustment challenges, with penalties issued against 33 banks and administrative actions taken against 2 banks for failing to align with proper credit pricing guidelines, leaving only three institutions fully compliant.
Anti-Money Laundering (AML/CFT) and Governance
To safeguard the financial system against illicit flows and align with global compliance standards:
Regulatory focus intensified on beneficial ownership tracing, Customer Due Diligence (CDD), and monitoring Politically Exposed Persons (PEPs).
The gazettement of the Banking (Penalties) Regulations standardized enforcement, ensuring explicit executive accountability for governance and compliance lapses.
Regulatory Compliance and Statutory Breaches
Supervisory oversight uncovered notable institutional vulnerabilities and instances of regulatory infractions across several tier groups:
Capital Adequacy Infractions:
Core Capital Violations: Seven commercial banks breached Section 7(1) of the Banking Act by failing to maintain the statutory minimum core capital requirement of Ksh 3 billion.
Capital Ratios: Five banks fell short of the required 14.5% total capital-to-risk-weighted-assets ratio, four missed the 10.5% core capital ratio, and three failed to maintain the 8% core capital-to-total-deposits ratio.
Lending Limit and Concentration Breaches:
Single-Obligor Limits: Ten commercial banks exceeded the single-obligor limit, restricting exposure to a single borrower to a maximum of 25% of core capital.
Insider Lending: Two banks breached the single insider borrowing limit (20%), and one bank exceeded the aggregate 100% ceiling on total insider borrowing.
Large Exposures: Three institutions breached limits restricting aggregate credit facilities for large exposures to no more than five times core capital.
Prohibited Business and Asset Restrictions:
Two commercial banks invested more than 20% of their core capital in land and buildings, violating non-banking asset investment caps.
Foreign Exchange and Liquidity Breaches:
Two banks exceeded the 10% core capital ceiling on foreign exchange exposure, while one commercial bank failed to meet the statutory minimum liquidity ratio of 20%.
Corporate Governance and Ownership Lapses:
Three banks violated the maximum 25% single-person ownership cap, and three institutions failed to meet board composition rules requiring at least five directors with a three-fifths non-executive majority.
Part 3: Digital Transformation, Mobile Money, and Alternate Delivery Channels
The banking sector’s operational landscape experienced rapid digital evolution, reshaping how financial services are delivered, secured, and regulated.
Digital Channels, Cybersecurity, and Cloud Governance
Infrastructure Resilience: Commercial banks aggressively scaled their digital channels—including mobile apps, internet banking, and agency networks—making technology infrastructure a critical pillar of operational risk management.
Cybersecurity Frameworks: With the rise in sophisticated cyber threats, institutions enhanced their defenses by implementing strict cloud governance policies, zero-trust architectures, and aligning their risk frameworks with international standards such as NIST and ISO.
Emerging Technologies: Institutions increasingly integrated data analytics, machine learning, and Robotic Process Automation (RPA) to automate backend processes, streamline loan origination, and improve automated customer onboarding (KYC).
Mobile Money Dynamics and the Transaction Size Paradigm
Agent Network Expansion: The mobile money agent network experienced significant physical growth, expanding by 24% with active agents increasing from 381,116 in 2024 to 473,536 in 2025.
The Transaction Volume Contraction: Paradoxically, despite the expanding agent and subscription base, the total volume of mobile money transactions dropped sharply by 30%, falling from 309.3 million transactions in 2024 to 217.6 million in 2025.
Resilient Transaction Values and Rising Average Size: Total transaction values fell far more modestly by just 4%, dropping from Ksh 753.5 billion to Ksh 722.5 billion. This divergence demonstrates that transaction volumes fell much faster than the overall value of funds transferred, indicating a clear structural shift toward a larger average size per mobile money transaction.
Shifting Customer Behavior: According to the Central Bank, users cut back on the frequency of low-value micro-transfers, opting instead to consolidate funds into fewer, higher-value payments. Concurrently, the growth of direct merchant payment systems and mobile banking apps reduced reliance on traditional agent-based cash-in/cash-out conversions.
Digital Credit Providers (DCPs): The regulatory perimeter expanded as the Central Bank licensed 195 Digital Credit Providers, bringing greater oversight, transparency, and consumer protection to the digital lending ecosystem.
Part 4: Segment Performance, Lending Trends, and Regional Expansion
The structure of Kenya’s financial architecture continued to evolve, defined by sharp distinctions across peer groups, ongoing balance sheet adjustments in microfinance, targeted credit allocations, and an expanding cross-border footprint.
Tiering, Market Concentration, and Peer Group Dynamics
Tier 1 (Large Banks): Dominated the sector, holding the lion’s share of net assets and driving profitability through economies of scale, extensive branch networks, and dominant digital ecosystems.
Tier 2 & Tier 3 (Medium and Small Banks): Focused on niche markets, targeted corporate banking, or regional plays, with several institutions navigating core capital compliance milestones and strategic repositioning.
Microfinance Banks (MFBs): Continued to face severe headwinds, characterized by contracting balance sheets, asset quality degradation, and systemic losses, prompting intensive strategic restructuring and business model reviews.
Sectoral Distribution of Credit
Commercial banks maintained a cautious and selective credit allocation strategy across various economic sectors, balancing growth opportunities against localized asset quality risks:
Personal / Household: Captured 24.5% of total credit allocation, up from 23.8% in the prior year, reflecting steady demand for consumer loans and salaried payroll financing.
Trade (Wholesale & Retail): Accounted for 18.2% of credit allocation, marking a slight decrease compared to 18.6% previously.
Manufacturing: Represented 15.1% of total advances, showing an increase from 14.8% in the prior year as productive enterprise lending remained a priority.
Real Estate & Construction: Comprised 13.8% of credit distribution, down from 14.2% as banks exercised caution around legacy non-performing assets.
Transport & Communication: Held 8.4% of credit allocation, an increase from 8.1% in the prior year.
Agriculture: Stood at 4.2% of total credit, reflecting a minor drop from 4.5% due to risk-averse positioning against climate and sector volatility.
Other Sectors (Mining, Financial, etc.): Accounted for the remaining 15.8%, down marginally from 16.0% in the prior period.
Regional Expansion and Cross-Border Footprint
East and Central African Strategy: Major Kenyan banking groups leveraged their capital strength to expand operations across regional markets, including Uganda, Tanzania, Rwanda, South Sudan, and the Democratic Republic of Congo (DRC).
Earnings Diversification: Regional subsidiaries played an increasingly vital role in bolstering group-level profitability, insulating parent balance sheets against domestic economic cycles, though exposing them to distinct foreign regulatory and geopolitical risks.
Part 5: Future Outlook and Supervisory Horizon
As the banking sector navigates shifting economic tides, the Central Bank of Kenya (CBK) continues to pivot toward advanced, tech-enabled regulatory oversight and tighter macroprudential safeguards to secure long-term systemic stability.
Granular Data Integration (GDI) and Off-Site Surveillance
Real-Time Regulatory Oversight: The CBK is advancing its transition toward automated, near-real-time off-site surveillance by linking its enterprise data warehouse directly with Supervised Financial Institutions (SFIs).
Data Precision: This architecture eliminates historical reporting lags, allowing regulators to track liquidity fluctuations, asset quality shifts, and credit concentrations dynamically rather than relying solely on periodic retrospective filings.
Focus on Domestic Systemically Important Banks (D-SIBs)
Systemic Risk Mitigation: Given the high concentration of assets among Tier 1 institutions, regulatory scrutiny remains intense on Domestic Systemically Important Banks—those whose failure or distress could trigger wider systemic contagion.
Higher Prudential Bars: D-SIBs face continuous stress testing, heightened recovery and resolution planning, and expectations for even stricter capital and liquidity buffers above the statutory minimums.
Evolving Supervisory Guidelines and Harmonization
Dynamic Prudential Overhauls: The CBK has signaled continuous reviews of prudential guidelines to keep pace with emerging fintech business models, digital assets, and climate-related financial risks.
Strengthening Governance: Future regulatory enforcement will heavily emphasize corporate accountability, transparent credit pricing alignment, and robust anti-money laundering (AML/CFT) frameworks to protect consumers and maintain international financial integrity.
Domestic Systemically Important Banks (D-SIBs): Technical Definition and Criteria
As regulatory frameworks evolve, increased supervisory attention is directed toward Domestic Systemically Important Banks (D-SIBs)—institutions whose distress or disorderly failure could trigger widespread financial instability and severe adverse repercussions for the domestic economy.
Technical Definition
A Domestic Systemically Important Bank (D-SIB) is defined as an institution whose sheer size, structural interconnectedness, complexity, and irreplaceable role in financial market infrastructure mean that its failure would cause disproportionate economic dislocation. Unlike global frameworks (G-SIBs), D-SIB evaluations assess systemic risk explicitly relative to the domestic economy.
Assessment Criteria and Weighting Indicators
Regulatory authorities determine systemic importance using a composite scoring methodology across five core structural factors:
Size (Weight: 40%): Measured by total assets and customer deposits relative to Gross Domestic Product (GDP), capturing the sheer financial magnitude of the institution.
Interconnectedness (Weight: 30%): Evaluates intra-financial system liabilities and assets, gauging how deeply entangled a bank is with other local and regional financial entities.
Substitutability (Weight: 15%): Assesses the market’s inability to easily replace critical services provided by the bank, focusing on consumer loans, trade finance, SME credit, and clearing/settlement participation via the Real-Time Gross Settlement (RTGS) system.
Importance to the Domestic Economy (Weight: 10%): Measures the institution’s localized footprint in driving core economic intermediation and financial access.
Complexity (Weight: 5%): Accounts for operational intricacies, including the volume of specialized financial securities, derivative assets, and cross-border footprints.
Prudential Implications for D-SIBs
Institutions crossing the systemic threshold face intensive regulatory requirements designed to internalize their risk:
Higher Loss Absorbency (HLA): Requirement to maintain additional Common Equity Tier 1 (CET1) capital buffers stacked above ordinary minimums.
Rigor and Surveillance: Mandatory quarterly stress testing against severe macroeconomic shocks, alongside deeper on-site and off-site inspections.
Recovery and Resolution Planning: Obligation to formulate and annually update exhaustive living wills detailing how the institution would restore viability under distress or wind down critical functions in an orderly manner.
Part 6: Innovation, Fintech Integration, and Emerging Technologies
The 2025 Bank Supervision Annual Report underscores a fundamental strategic pivot across Kenya’s financial landscape: traditional institutions are increasingly evolving into data-driven technology and fintech-enabled operations.
Strategic Positioning and Digital Frameworks
Commercial banks and financial institutions categorized their digital strategies into distinct models to capture changing market demands:
“Better Banks” (71% of institutions): Focused on upgrading existing operations and infrastructure using fintech tools rather than rebuilding from scratch.
Distributed Banks (17% of institutions): Leaning heavily on collaborative partnerships with external fintech startups.
New / Digital-Native Banks (8% of institutions): Building fully digital-native banking platforms from the ground up.
Infrastructure Backbone: 84% of commercial banks and 79% of microfinance banks adopted Application Programming Interfaces (APIs), making them the most common technological plumbing layer, complemented by cloud computing, big data analytics, and biometric authentication (averaging around 45% adoption).
Artificial Intelligence Adoption and Governance Gaps
Adoption Milestone: AI integration crossed the halfway mark, with 66% of commercial banks, 57% of microfinance banks, and 43% of digital credit providers deploying AI solutions largely for electronic KYC, credit scoring, and automated customer service.
The Governance Gap: While 62% of institutions established dedicated data or AI teams, only 30% instituted a formal AI strategy, leaving significant demand for comprehensive regulatory frameworks covering data governance, risk management, and algorithmic transparency.
Third-Party Dependencies and Cybersecurity Risks
Vendor Reliance: Every surveyed commercial and microfinance bank relies on external third-party technology providers for cloud services, mobile banking architectures, or core infrastructure.
Risk Management: To counter escalating cyber threats, institutions implemented rigorous third-party risk management frameworks, requiring vendor compliance with international standards such as ISO 27001 and PCI-DSS.
About Boardlot Africa Research
Boardlot Africa is a premier financial intelligence and corporate governance publication dedicated to unpacking the mechanics of capital, market strategies, and structural shifts across East Africa’s corporate landscape. By bridging the gap between raw economic data and actionable market intelligence, we deliver deep-dive research, independent corporate analysis, and policy insights designed for institutional investors, boardrooms, and sharp market observers.
Get in Touch
Email: boardlot.research@gmail.com
Phone: +254 753 133 901
Substack: Subscribe to Boardlot Africa
X (Twitter): BoardLotSultan
Linkedn:): BoardLot Sultan