
The Asymmetry of Corporate Reward: Centum PLC and the Minority Shareholder Dilemma
1. The KES 5 Million Experiment
Imagine it is 2017. The Nairobi Securities Exchange (NSE) is buzzing, and you decide to deploy KES 5,000,000 into Centum Investment PLC ($CTUM), widely marketed as the premium investment channel for East African private equity. At the prevailing market price of KES 40.00 per share, your capital secures you exactly 125,000 shares. You trust the diversification strategy, buy into the long-term vision of institutional growth, and lock the shares away.
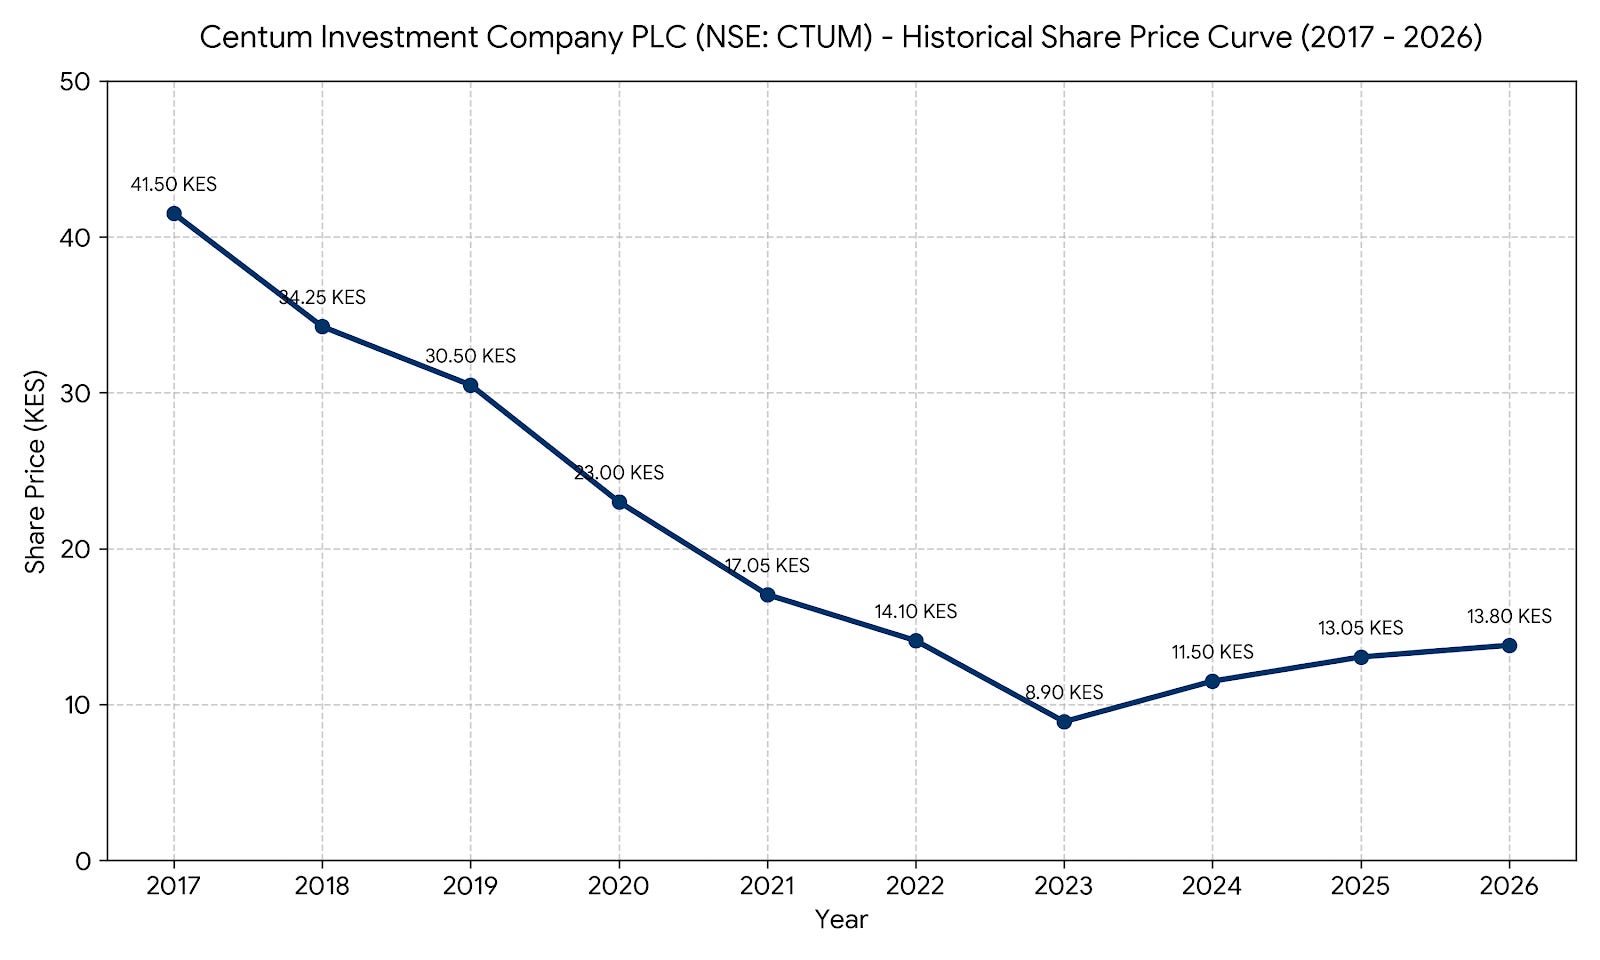
Fast forward to May 2026. The stock market ticker tells a grim story. Centum’s share price languishes around KES 13.80. Your KES 5,000,000 principal has shriveled to a current portfolio market value of just KES 1,725,000.
This represents an absolute, nominal capital destruction of KES 3,275,000—a staggering 65.5% wipeout of your core equity.
This is not simply a story about a bad trade or a cyclical market downturn. It is a stark look into a structural asymmetry embedded within corporate Kenya: the growing divide between executive compensation and the reality of the minority retail investors who fund the corporate balance sheet.
2. The Dividend Cushion Illusion
When confronted with multi-year capital erosion, defenders of sluggish equity performance frequently point to dividend yields as the ultimate shock absorber. Let’s look at the actual cash flows to test this theory.
If you held those 125,000 shares from 2017 through 2025, your annual dividend receipts tracked the following trajectory based on official audited distribution updates:
Historical Dividend Payout Inflows (2017 – 2025)
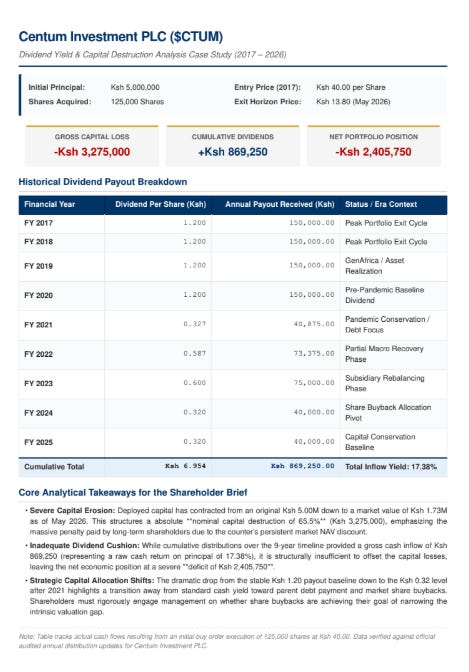
Over nearly a decade, your total cash dividend yield amounted to KES 869,250. When offset against your KES 3,275,000 capital hit, your net economic position remains stuck at a severe deficit of KES 2,405,750.
The dividend cushion didn’t absorb the shock; it barely dented it.
3. The Executive Suite: Heads I Win, Tails You Lose
Now, let us turn our attention to the executive suite. Over the identical 10-year horizon, Centum’s leadership compensation operated in a completely different financial orbit, accumulating over KES 750M in total pay.
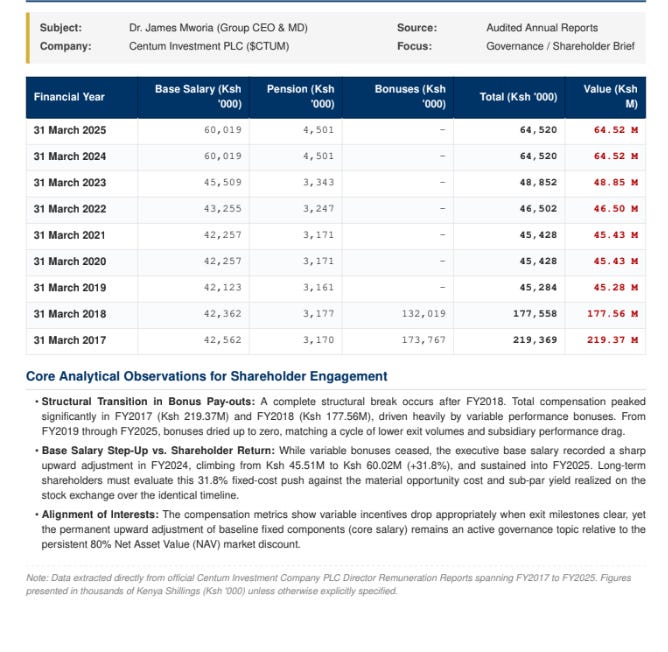
During the peak asset realization years of FY2017 and FY2018, the Group CEO’s total remuneration triggered intense public and shareholder controversy. Driven by massive, exit-linked variable performance incentives, total executive compensation clocked an astronomical KES 219.3M and KES 177.5M respectively.
When portfolio exits slowed down and subsidiary performance dragged, the variable bonus structure responded as designed: bonuses dropped to zero from FY2019 through FY2025. On paper, this implies shared risk. But a closer look at the fixed baseline component exposes the true disconnect:
The Performance Dip: From FY2019 onward, underlying asset valuations softened and shareholder equity bled out in the open market.
The Executive Salary Step-Up: In FY2024, the executive base salary recorded a sharp, permanent +31.8% structural upward adjustment, jumping from KES 45.5M to KES 60.02M—a fixed baseline that was maintained straight into FY2025.
The Total Fixed Increase: Looking at the broader arc since FY2019, baseline fixed pay climbed by roughly 65% over the cycle.
This means that while the company’s performance metrics compressed and minority shareholders shouldered a 60%+ drop in market equity, the executive baseline fixed cost grew significantly.
4. The Deep Value Disconnect: NAV vs. The Market
Management historically defends these dynamics by pointing to Centum’s underlying Net Asset Value (NAV), arguing that the share price suffers from an irrational, persistent ~80% market discount.
However, for a retail or institutional investor, a portfolio is defined by market liquidity and realizable value, not book value. If the executive suite’s fixed compensation expands while the massive market discount remains unmitigated, corporate reward becomes entirely decoupled from shareholder reality. The business effectively functions as a highly rewarding, fixed-cost operation for its managers, while acting as a capital-loss trap for its owners.
5. Hard Questions for the Next AGM
Centum’s ongoing share buyback program, executed in the KES 13–14 range, signals an acknowledgment that the stock is deeply undervalued. Yet, buybacks can also serve as a defensive mechanism to patch over a deeper structural issue: an elevated corporate cost center operating independently of public market performance.
As the next Annual General Meeting approaches, long-term value investors must move past standard pleasantries and bring hard, data-driven governance questions to the floor:
On Baseline Adjustments: If the principle of “shared risk” dictates that variable bonuses hit zero when performance targets are missed, what economic justification supports a 31.8% permanent step-up in fixed baseline salary during a cycle of severe market capital destruction?
On Strategic Allocation: With cash dividend distributions structurally reduced to KES 0.32 to fund share buybacks, what is the definitive, mathematically backed timeline for these buybacks to successfully narrow the 80% NAV discount and restore the lost KES 3.2M per block of capital?
For the Nairobi Securities Exchange to attract and sustain patient local capital, corporate governance cannot just be a compliance checklist. The alignment between executive reward and minority equity protection must be absolute. Until that balance is restored, retail capital will continue to bear the downside of the market, while executive structures remain insulated at the top