
BAT Kenya Investment Recommendation
Following BAT Kenya’s historic FY 2025 financial disclosures, we issue an Aggressive Accumulation recommendation on the counter, targeting a tactical post-dividend entry range of KES 470.00 to KES 520.00. By building positions after the massive KES 70.00 per share payout is stripped from the market price, income-focused investors can lock in a highly resilient, double-digit structural yield supported by a deep KES 10 Billion balance sheet reserve. This strategic entry acts as an unparalleled tactical income play, allowing portfolios to secure outsized cash-on-cash returns that significantly outpace traditional fixed-income alternatives and money market funds.
However, this aggressive stance is balanced against severe long-term structural warning signs, as excessive excise taxation and a rampant 45% illicit market continue to drive down core domestic revenues. While world-class cost-cutting and a powerful regional export shield have temporarily protected the bottom line, the company is rapidly approaching its ultimate operational efficiency ceiling. Consequently, investors must treat the upcoming H1 2026 half-year earnings numbers as a mandatory checkpoint, closely auditing the data for signs of revenue stabilization, regional export resilience, and rapid scaling in the non-combustible nicotine pouch segment before extending their long-term capital exposure
The 14% Cash ATM: A Deep Dive into BAT Kenya’s Historical FY 2025 “Super-Dividend”
1. HISTORY MADE: BAT Kenya’s KES 70 Payout is the Highest Dividend/Share on the NSE
British American Tobacco Kenya ($BATK$) has just rewritten the history books on the Nairobi Securities Exchange. The announcement of a KES 70.00 total dividend per share marks the single highest absolute dividend distribution per share ever witnessed on the local bourse. For decades, blue-chip income seekers looked to financial anchors like Standard Chartered or EABL; however, BAT Kenya’s latest payout has completely altered the defensive equity landscape, establishing a new absolute benchmark for cash distributions in corporate Kenya.
2. How BAT Dividend is Beating Top-Tier MMFs & T-Bills
In a market context where fixed-income returns have historically crowded out equity interest, this announcement changes the math for income-focused portfolios. At its current trading price, a KES 70.00 distribution translates to a staggering 14% trailing dividend yield. This single move completely reshapes how asset allocators look at local liquidity, offering an unprecedented equity risk premium over traditional low-risk cash parking vehicles.
3. If You Had KES 100,000 to Invest for Income, Where Do You Go?
To put the sheer scale of this payout into perspective, consider a baseline allocation of KES 100,000 deployed across the NSE’s premier income counters compared to BAT’s new reality:
EABL (FY24 Asset Trajectory): Generates KES 5,185 in annualized cash income.
Standard Chartered Bank Kenya (SCBK FY24): Generates KES 15,676 in annualized cash income.
BAT Kenya (FY25 New Announcement): Generates a massive KES 20,000 in cold, hard cash.
BAT Kenya has effectively delivered a 14% cash-on-cash return. In modern equity markets, capturing that level of cash generation from an established consumer defensive stock is practically unheard of.
4. Why Savvy Investors Will Swap MMF Safety for BAT Kenya’s Massive 14% Dividend
For the past few quarters, retail and institutional capital in Kenya has hidden out in capital-preserving instruments. Yet, the sheer size of this 14% yield issue throws down an aggressive challenge to every Money Market Fund (MMF) manager in the country. It forces savvy wealth managers to reconsider the traditional equity risk trade-off when a single stock provides near-guaranteed outsized income flows relative to standard fund allocations.
5. MMF vs. BAT: How $BATK is Beating Top-Tier MMFs
The spread speaks for itself:
Standard MMFs: Averaging 12.0% %
Central Bank T-Bills: Hovers around 10%
BAT Kenya Equity Yield: Sits at 14%
6. The BAT Profit Paradox: Total Revenue Dropped 10% Due to Illicit Trade, but Net Profit JUMPED 18% to KES 5.2B
The core financials behind the payout present a striking paradox. Gross revenue for the period actively contracted by 10%, driven under by a rampant parallel market. Yet, bottom-line net profit expanded by an incredible 18% to reach KES 5.2 Billion.
How did they pull this off? Through brutal operational efficiency. Total operating expenses were slashed by 15%, proving that a mature business doesn’t necessarily need top-line expansion to deliver record-breaking bottom-line dividends to its owners.
7. Dividend Payout Strategy: They Paid KES 7.0B vs. KES 5.2B in Profit (135%)
BAT Kenya has historically maintained a committed 100% dividend payout policy. However, for FY25, the board went completely off the rails:
Total Reported Net Profit: KES 5.2 Billion
Total Declared Cash Dividend: KES 7.0 Billion
Effective Payout Ratio: 135%
Where did the extra KES 1.8 Billion come from? Management went straight into their deep KES 12 Billion balance sheet reserves. It is a deliberate strategy of returning “lazy cash” to shareholders because the local macroeconomic climate offers no viable capital expenditure projects worthy of retaining that liquidity.
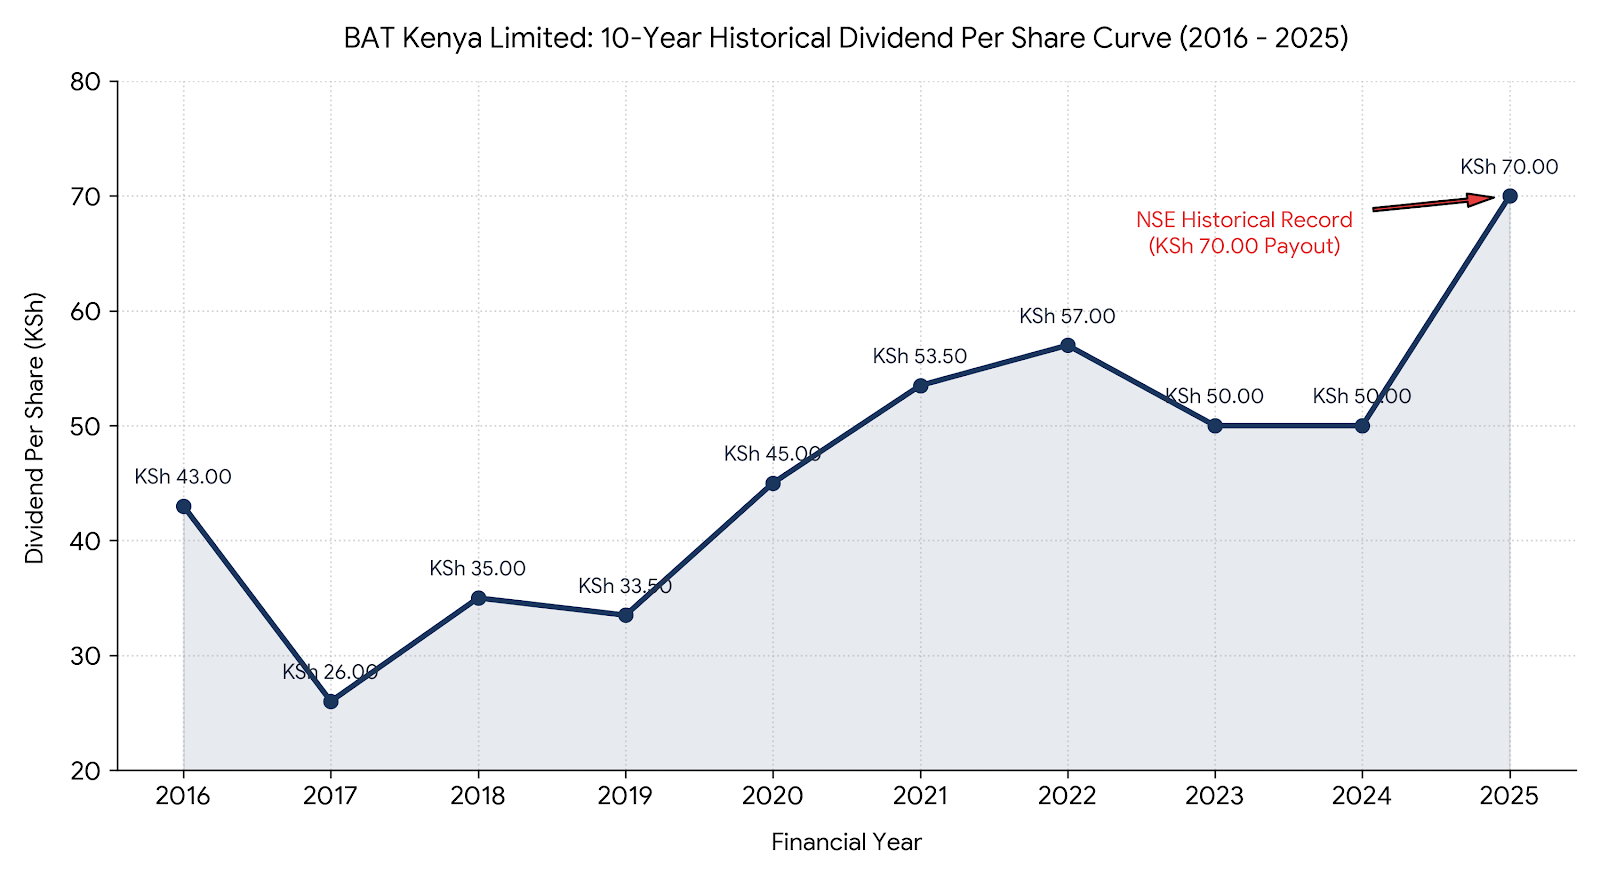
Historical Dividend Tracked (KSh per Share):
2016: KSh $43.00$
2017: KSh $26.00$ (Sharp contraction following the sudden 50% excise tax hike in late 2015)
2018: KSh $35.00$
2019: KSh $33.50$
2020: KSh $45.00$ (Interim KSh 3.50 + Final KSh 41.50)
2021: KSh $53.50$ (Interim KSh 3.50 + Final KSh 50.00)
2022: KSh $57.00$ (Interim KSh 5.00 + Final KSh 52.00)
2023: KSh $50.00$ (Interim KSh 5.00 + Final KSh 45.00)
2024: KSh $50.00$ (Interim KSh 5.00 + Final KSh 45.00)
2025: KSh $70.00$ (Historical Record Peak Payout) (Interim KSh 10.00 + Final KSh 60.00)
Key Takeaways from the Chart Profile:
The Payout Paradox Spike: The visual shows a steady climb out of the 2017 lows, forming a stable shelf at KSh $50.00$ across 2023–2024, followed by a dramatic vertical climb to KSh $70.00$ in 2025.
Capital Efficiency: This sudden jump in the curve perfectly mirrors the company’s decision to shift away from local capital investments (as their local commercial lines encounter friction) and return built-up balance sheet reserves to long-term investors.
8. Analyzing the Reserves: How Long Can This “Super-Dividend” Last?
Skeptics will instantly question the structural sustainability of paying out more than a company earns. However, a deeper look at the balance sheet numbers dispels immediate panic. Even after drawing down KES 1.8 Billion to top up this year’s distribution, BAT Kenya still sits on approximately KES 10 Billion in retained earnings. At this consumption rate, the company can comfortably sustain an “over-payout” strategy for another 5 years, even if local domestic volumes remain completely flat.
9. Declining Sales Trend: Temporary or Terminal?
The top-line warning lights, however, are impossible to ignore. Gross sales landed at KES 36.0 Billion in 2025, continuing a clear downward trend from its KES 42.0 Billion peak seen in 2022. Aggressive local excise taxes are systematically pricing legal cigarettes right out of the pockets of ordinary Kenyan consumers, and illicit untaxed operators are moving quickly to fill the vacuum. The overall domestic commercial cake is shrinking every single year.
10. Fact-Checking Counterfeits: Is BAT Losing the War on Counterfeits?
Management explicitly noted that illicit, non-tax-compliant cigarettes now command a staggering 45% of the local market share. Hard economic indicators from the government back up this claim: the Kenya Revenue Authority (KRA) reported a 13.9% drop in tobacco excise collections for the 2024/25 fiscal cycle. Despite millions spent implementing the “Track & Trace” Electronic Cargo Tracking and Excisable Goods Management System (EGMS), the enforcement system is leaking badly, and legal volumes are being aggressively cannibalized by untaxed rivals.
11. The Export Shield: Gross Export Sales Climbed from KES 12.5B to KES 18.2B
Fortunately, BAT Kenya possesses a powerful, hidden structural counterweight: its export manufacturing business. Since 2021, the company’s gross export revenues have risen from KES 12.5 Billion to KES 18.2 Billion.
The state-of-the-art manufacturing plant in Nairobi is effectively staying afloat by churning out and shipping tax-free sticks across regional markets like Somalia, the Democratic Republic of Congo (DRC), and Zambia. Cross-border regional exports now account for 50% of total revenue, serving as the company’s ultimate defensive shield.
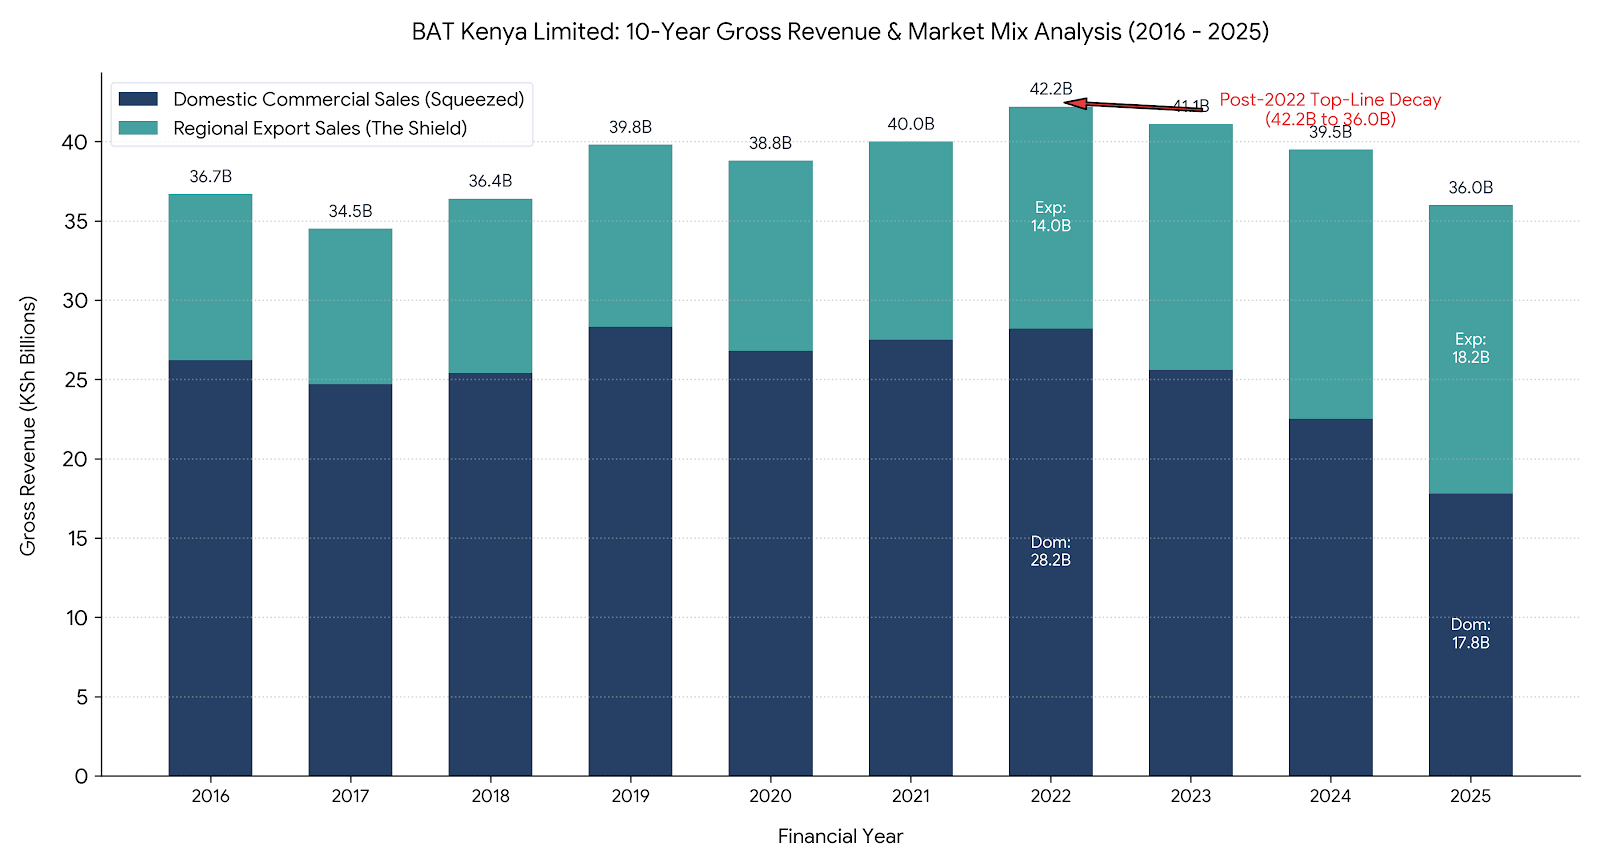
BAT Kenya’s 10-Year Gross Revenue & Market Mix Analysis (2016–2025) to clearly visualize the structural changes under the hood of their top line.
Key Insights Highlighted by the Graph
The Post-2022 Contraction: The visualization clearly marks the absolute top-line decay described in your analysis, showing a sharp descent from the KSh 42.2 Billion peak in 2022 down to KSh 36.0 Billion in 2025.
The Domestic Squeeze vs. Export Shield: By stacking Domestic vs. Export sales, the graph illustrates the true Profit Paradox. Domestic commercial sales (dark blue) have shrunk dramatically from KSh 28.2 Billion in 2022 to just KSh 17.8 Billion in 2025 due to the 45% illicit market and high excise taxes.
The 50% Crossing Point: You can clearly see how regional export sales (teal) have risen reliably from KSh 12.5 Billion in 2021 to KSh 18.2 Billion in 2025, expanding to command exactly 50.5% of total corporate revenues by the close of the FY25 cycle.
12. The Taxation Trap: BAT Gross Sales vs. Excise Taxes (2021-2025)
BAT Kenya is currently caught in a textbook fiscal vice. As the company’s underlying gross commercial sales face volume pressure, the absolute tax burden it remits to the Government of Kenya continues to scale higher. It is the literal definition of a corporate business that is forced to work significantly harder operationally, only to keep less of its gross economic output.
Net Sales Revenue (Deep Green Base): This is the net income BATKenya retains after excise duty and value-added tax (VAT) are paid. This represents the core commercial earnings of the business.
Excise & VAT Taxes (Dark Grey Top): This is the tax portion extracted from the consumer at the point of sale and remitted directly to the Government of Kenya. This represents the total non-income tax burden.
Key Observations: The most striking feature of this graph is the widening grey gap. While the Gross Sales bars begin to slope downward after 2022, the tax portion (grey) actively increases its share, particularly in 2024–2025. This visually confirms your “Taxation Trap” analysis: BATKenya is working harder but keeping significantly less of its economic output.
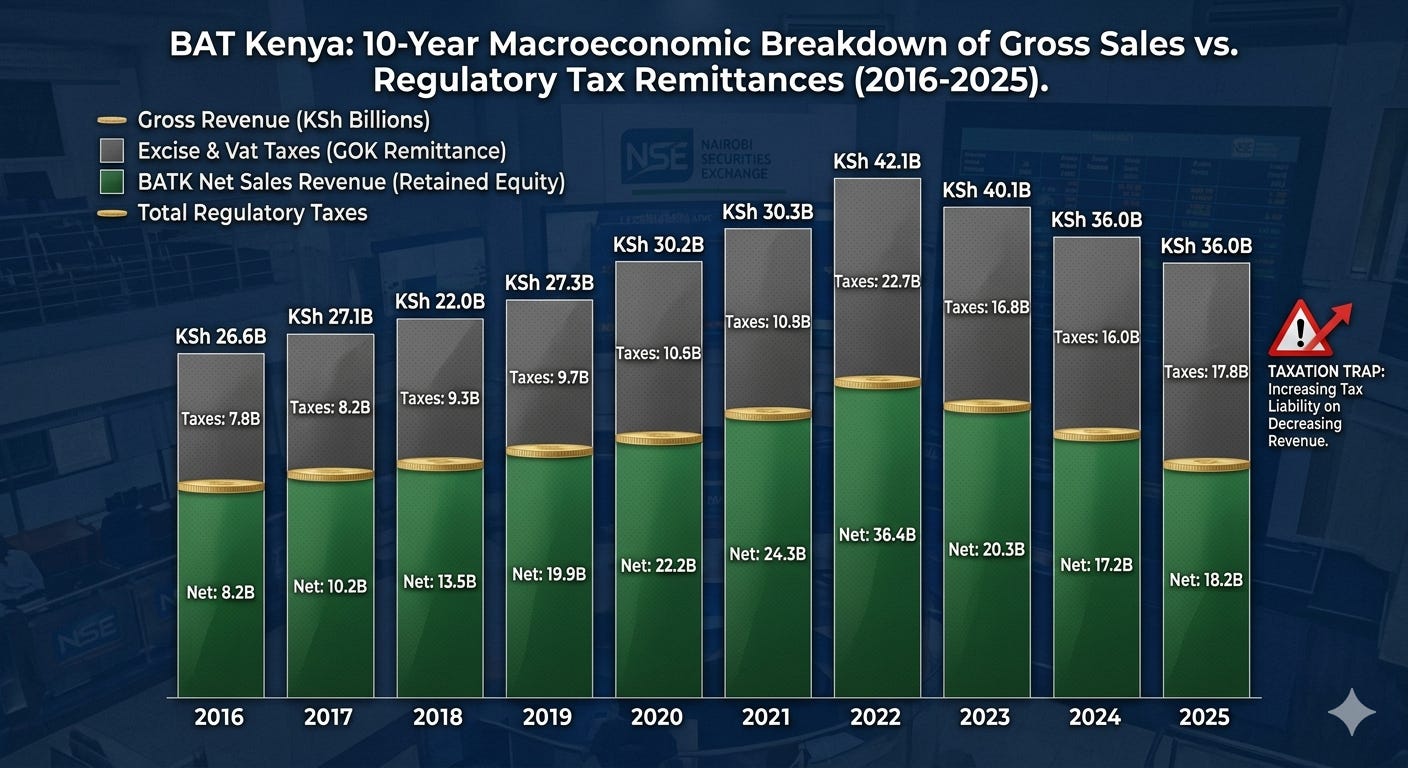
13. The Tax Paradox: Lower Sales, Higher Tax?
The ultimate anomaly occurred this financial year: BAT remitted a larger absolute tax bundle to the state than the previous year, despite selling fewer physical products. This happened because of sudden mid-year excise duty adjustments. BAT sold fewer units overall but paid a much higher tax rate per stick. This serves as a stark Laffer Curve warning for policy makers: over-taxing a legal luxury good eventually suffocates the legitimate business while funding the black market.
14. Margin Fact-Check: Margins Improved, but Was It Just “Efficiency”?
While management took credit for a stellar 15% drop in operating expenditures (OpEx), a critical look at the numbers shows that external factors lent a major helping hand:
Foreign Exchange Gains: A stabilizing Kenyan Shilling drastically cut raw material import costs.
Drastic Marketing Cuts: The company essentially stopped spending big capital fighting a defensive war on retail shelves.
Global Commodity Stability: Leaf tobacco input prices remained soft on international markets.
While operational efficiency remains world-class, investors must realize the company is rapidly approaching its ultimate cost-cutting ceiling.
15. The Efficiency Gap: Net Margin Spiked to 20.3% in 2025
Despite the top-line pressures, BAT Kenya pulled off an incredibly impressive financial squeeze. While gross margins remained solid at 69%, the real standout metric was the net profit margin, which spiked to a record 20.3% in 2025. The company is now keeping more than 20 cents out of every single Shilling collected—up from 15 cents just two years ago—largely because they aggressively trimmed administrative expenses to protect the dividend payout.
16. The Future of Nicotine: The Growth Savior, Nicotine Pouches?
Can the business pivot in time? BAT Kenya is betting its entire long-term survival on “Non-Combustible” nicotine alternatives by 2030. Currently, alternative categories like their Lyft/Velo nicotine pouch lines contribute less than 5% of total corporate revenue, though they are expanding at an impressive 40% Year-on-Year (YoY) clip. It is a high-stakes race against time: can alternative pouches scale fast enough to fully replace a structurally declining cigarette business?
17. Bottom Line: $BATK is the Ultimate “Cash ATM”
The core investment thesis for this stock now splits cleanly down the middle depending on your profile:
For the Income Seeker: Yield is absolute king. Revenue may be under pressure, but management has proven they will aggressively cut costs and tap reserves just to hand you 20% in direct cash.
For the Growth Seeker: The structural red flags are completely clear.
In an uncertain, consolidating domestic market, immediate cash flow is the only absolute certainty.
18. The $BATK 5-Year Cheat Sheet
To summarize the entire corporate profile at a single glance:
Top-Line Sales: Structurally declining ($42\text{B} \rightarrow 36\text{B}$ KES).
Operational Efficiency: Net Margins sitting at a record 20.3%.
Defensive Shield: Regional export operations now command 50% of revenue.
Liquidity Position: KES 70.00 dividend per share unlocked by dipping into historical cash reserves.
It stands as a brilliant masterclass in successfully harvesting maximum value out of a mature, declining market.
19. BAT: The Red Flag vs. Green Flag Breakdown
When weighing whether to allocate capital into this counter today, the factors balance out clearly:
BAT Kenya: The Bulls vs. The Bears
🟢 The Green Flags (The Bull Case)
20.1% Dividend Yield: A massive cash-on-cash return that is impossible for traditional fixed-income and money market funds to ignore.
World-Class Cost Efficiency: Brutal optimization and a 15% reduction in operating expenditures are keeping bottom-line profitability remarkably high despite top-line friction.
KES 10 Billion in Balance Sheet Reserves: A deep cash buffer capable of comfortably funding and supporting dividend payout top-ups for approximately 5 years.
🔴 The Red Flags (The Bear Case)
Rampant Illicit Trade: The parallel black market is actively winning the volume war, now controlling a staggering 45% of the total domestic market share.
The Taxation Trap: Aggressive fiscal policies and mid-year excise hikes have hit an operational breaking point with local regulatory authorities, squeezing the legal business.
Terminal Core Volume Decay: Underlying domestic sales volumes are facing long-term structural decline, exposing the limitations of relying purely on cost-cutting over the next decade.
The Ultimate Verdict: BAT Kenya operates like a high-yield annuity. Management is squeezing every single cent of operational efficiency out of their mature business to hand you cash right now while they buy time to pivot to alternative nicotine products. If you want cash in hand today, it is king. If you are looking for 10-year structural growth, look elsewhere.
Executive Summary
Following BAT Kenya’s historic FY 2025 financial results, we are issuing an Aggressive Accumulation recommendation on the counter within a price range of KES 470.00 to KES 520.00. This position should be built tactically once the stock trades ex-dividend, allowing investors to capture a lower cost-basis entry after the KES 70.00 payout is deducted from the market price. While the stock represents an unparalleled cash cow in the near term, structural top-line pressures remain a fundamental risk; therefore, this stance is contingent on a strict evaluation of the upcoming H1 2026 financial disclosures to track volume stabilization.
The Tactical Thesis: Capitalizing on the Post-Dividend Drop
When a company pays an absolute dividend as large as KES 70.00, the market price naturally recalibrates downward by a similar margin on the ex-dividend date.
The Entry Window: Entering the stock post-dividend in the KES 470 – KES 520 zone strips away the immediate “dividend premium” inflation from your purchase price.
The Yield Play: At a post-dividend entry of KES 500.00, even if the board normalizes future payouts slightly downward to KES 55.00–60.00 in subsequent years, you are still locking in a permanent, structural yield of 11% to 12%. This handsomely outpaces long-term equity averages and narrows the gap with current fixed-income yields without locking your capital up for decades.
Reserves Safety Net: With KES 10 Billion remaining in retained earnings, the company possesses a balance sheet buffer capable of defending outsized payouts for the next few years while it manages its structural transition.
The Structural Risk: Monitoring the Top-Line Decay
Despite world-class operational efficiency (slashing operating expenses by 15% and driving net margins to a record 20.3%), BAT Kenya cannot cut its way to growth indefinitely. The business is hitting a domestic ceiling caused by a severe macroeconomic vice:
Gross sales have trended downward from KES 42.0 Billion to KES 36.0 Billion, proving that high excise taxes are actively pricing legal cigarettes out of the market and feeding untaxed parallel networks. The Nairobi factory is currently being cushioned by its regional export business (Somalia, DRC, and Zambia), which now shields 50% of total revenue.
Mandatory Checklist for Investors: The H1 2026 Pivot Point
This aggressive accumulation strategy requires active monitoring. Investors must meticulously audit the H1 2026 half-year results for specific performance indicators before extending their exposure:
Volume Stabilization: Look for a flattening or reversal in the domestic cigarette volume decline. Is the KRA’s enforcement slowing down the 45% illicit trade leak?
Nicotine Pouch Scaling: Check the growth velocity of non-combustible products (Velo/Lyft). They must continue growing at $\ge 40\%$ YoY to prove they can scale fast enough to replace the traditional tobacco business by 2030.
Export Margin Retention: Ensure that regional export channels are maintaining their profitability margins and aren’t being eroded by rising cross-border logistics or political headwinds in Central and East Africa.
Conclusion: Accumulate aggressively on the price dips post-dividend for immediate income generation, but keep a tight leash on the position until H1 2026 data confirms whether the top-line revenue decay has found a structural bottom.