
The Sultan’s Verdict: Allocation Strategy
The numbers don’t lie: The Process is out accelerating the Squad.
In Q1 2026, Equity Group’s Earnings Per Share (EPS) grew roughly 50% faster than KCB’s. When a digital system achieves that level of operating leverage while tightening its defense (NPLs down to 10.6%), it demands an aggressive accumulation strategy.
1. Equity Group (EQTY) — The Premium Compounder
Action: Accumulate
Buy Range: KES 75.00 – KES 79.00
Target Price: KES 100.00 (Q1 2027)
The Take: With regional subsidiaries driving 51% of profits, Equity is a pan-African growth machine. The market is mispricing its digital velocity. Buy the dips.
2. KCB Group (KCB) — The Value Recovery Play
Action: Accumulate
Buy Range: KES 65.00 – KES 75.00
Target Price: KES 90.00 (Q1 2027)
The Take: KCB boasts an ultra-lean 45% cost-to-income ratio. Once they clean up their sticky Kenyan corporate defaults, expect a massive valuation re-rating.
The Bottom Line: Hold KCB for the deep value unlock, but anchor your portfolio in Equity for high-velocity compounding.
Comparing KCB to Equity is Like Comparing Man City’s Player Spend to Arsenal’s Process
The East African banking sector has just witnessed a historic week. Within a 24-hour window, the region’s two financial titans laid bare their Q1 2026 scorecards. Equity Group kicked things off by revealing a 24% surge in Profit After Tax (PAT) to KES 19.1 billion. The very next day, KCB Group fired back, crossing the KES 2.1 trillion asset mark and posting a KES 18.2 billion PAT.
To the casual observer, it looks like a standard, neck-and-neck corporate derby. But if you sit down with the financial forensically and look at how these two institutions evolved over the ten-year stretch from FY 2016 to FY 2025, you realize something profound. This isn’t just a battle for market share. It is a fundamental clash of organizational design.
Comparing KCB Group to Equity Group is like comparing Manchester City’s player spend to Arsenal’s Process. One functions via sheer balance-sheet muscle, heavyweight acquisitions, and high-impact corporate lending squads. The other relies on an aggressive, highly repeatable, mass-market digital system that forces the entire ecosystem to play at its velocity.
The Starting Grid: The 2016 Shocks
To appreciate how the field tilted, we have to go back to 2016. Back then, KCB was the undisputed heavyweight king of East African banking, sitting on a balance sheet of KES 595.2 billion. Equity was the lighter, hungry challenger at KES 474.1 billion.
equitygroupholdings.com
Then came the 2016 Banking Amendment Act (The Interest Rate Cap). It was the regulatory equivalent of a sudden Financial Fair Play (FFP) shock, slashing lending margins overnight and throwing traditional business models into chaos. The two teams responded with completely different tactical playbooks:
The KCB Model (City’s Squad Depth): KCB leaned heavily into its massive balance sheet size and public-sector heritage. To offset compressed retail margins, they doubled down on heavy corporate lending and massive state-linked balance sheets. They bought their way into new dimensions, utilizing mergers and acquisitions like a club buying superstar center-backs.
The Equity Model (The Arsenal Process): Equity looked at the loan cap and chose not to fight a volume war on restricted credit terms. Instead, they initiated an intensive, long-term technical overhaul: de-risking through mass digitization. They began systematically moving transactions off the physical branch network and onto mobile rails, fundamentally rebuilding their cost structure from the ground up.
James Mwangi's Talent Factory: Why Equity’s Leadership Depth is the Ultimate Lead Indicator.

Sultan’s Recommendation on Equity Bank Stock, May 2026
10 Years of Evolution: Bricks vs. Bytes
A decade of executing these contrasting philosophies has created two completely different corporate engines.
1. The Transfer Market: M&A vs. Scouting
KCB’s growth strategy has consistently relied on buying established capacity to instantly command the pitch. Over the decade, they pulled off blockbuster structural acquisitions—absorbing National Bank of Kenya (NBK) to secure a massive state deposit base, and later executing a massive transaction to buy Trust Merchant Bank (TMB) in the DRC. Like Man City assembling an elite squad, it gave them instant scale, but left management with complex, legacy integration challenges.
Equity, conversely, treated regional expansion as a plug-and-play installation of their core retail blueprint. When they entered the DRC via BCDC, they didn’t preserve it as a standalone corporate boutique; they aggressively re-engineered it into a high-velocity engine for retail and MSME deposit mobilization.
Key Narrative Visuals for Your Substack:
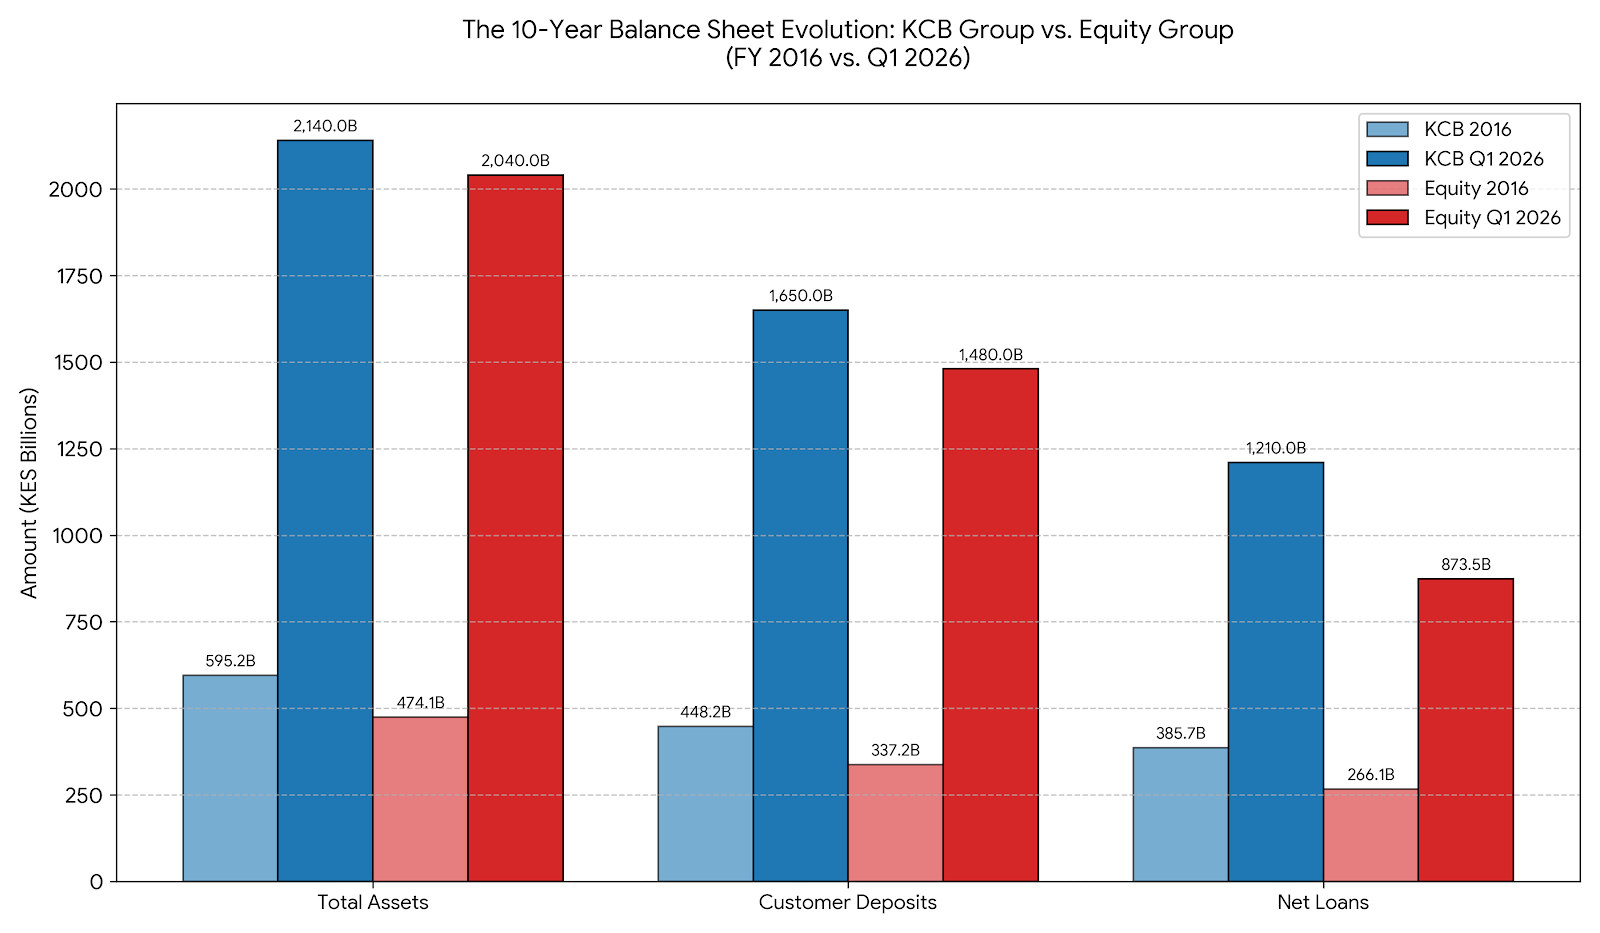
The Shrinking Gap: Visually, you can see how Equity’s solid red bar for Total Assets has almost entirely caught up with KCB’s solid blue bar, narrowing what was once a massive headstart.
The Loan Book Divergence: Notice the rightmost cluster (Net Loans). KCB’s aggressive asset deployment approach stands out clearly here, with their loan book stretching significantly higher relative to their total asset base compared to Equity’s structurally lighter, more liquid allocation model
2. Key Balance Sheet Lines: KCB Group
Total Assets: Exploded from KES 595.2 billion at the end of 2016 to KES 2.14 trillion in Q1 2026, cementing its place as the region’s largest absolute balance sheet through aggressive corporate lending and the consolidation of major regional units like TMB in the DRC.
Customer Deposits: Scaled up from KES 448.2 billion (2016) to KES 1.65 trillion (Q1 2026), driven heavily by its deep public-sector relationships and retail deposit collection across its expanded regional network.
Net Loans & Advances: Marched from KES 385.7 billion (2016) to KES 1.21 trillion (Q1 2026), reflecting KCB’s consistent strategy of heavily deploying its capital into large corporate credit and infrastructure portfolios.
Key Balance Sheet Lines: Equity Group
Total Assets: Surged more than fourfold from KES 474.1 billion (2016) to cross the historic KES 2.04 trillion mark in Q1 2026, effectively wiping out the massive asset gap that KCB held a decade prior.
Customer Deposits: Grew from KES 337.2 billion (2016) to KES 1.48 trillion (Q1 2026), anchored by its massive retail base of 22.7 million customers and its hyper-efficient digital deposit mobilization platforms.
Net Loans & Advances: Shifted from KES 266.1 billion (2016) to KES 873.5 billion (Q1 2026). This slower relative loan growth highlights Equity’s tactical shift away from capital-heavy corporate books, choosing instead to run a leaner MSME asset-allocation system while parking liquidity in liquid regional assets.
The Balance Sheet Takeaway:
In 2016, KCB’s balance sheet was over 25% larger than Equity’s. By Q1 2026, Equity’s digital pipeline allowed it to narrow that gap to less than 5%. More importantly, Equity now extracts higher net profitability from a slightly smaller asset base, proving to your readers that “The Process” maximizes capital efficiency far better than traditional asset volume.
3. Midfield Efficiency: The Cost-to-Income Derby
This is where “The Process” pays off. By the close of the FY 2025 cycle, Equity’s relentless migration to self-service channels hit an astonishing milestone: 98.3% of all customer transactions now happen completely outside physical branches. They run an incredibly lean midfield where digital infrastructure carries the weight.
KCB historically carried a heavier operational burden, a direct consequence of its corporate lending heritage and the physical branch networks inherited from its acquisitions. However, showing classic elite management, KCB executed a brilliant tactical cleanup in 2025 by divesting and completing the sale of National Bank of Kenya to Access Bank. By cutting away that legacy cost drag, KCB’s operational efficiency sharpened drastically, proving they can trim the payroll when the system demands it.
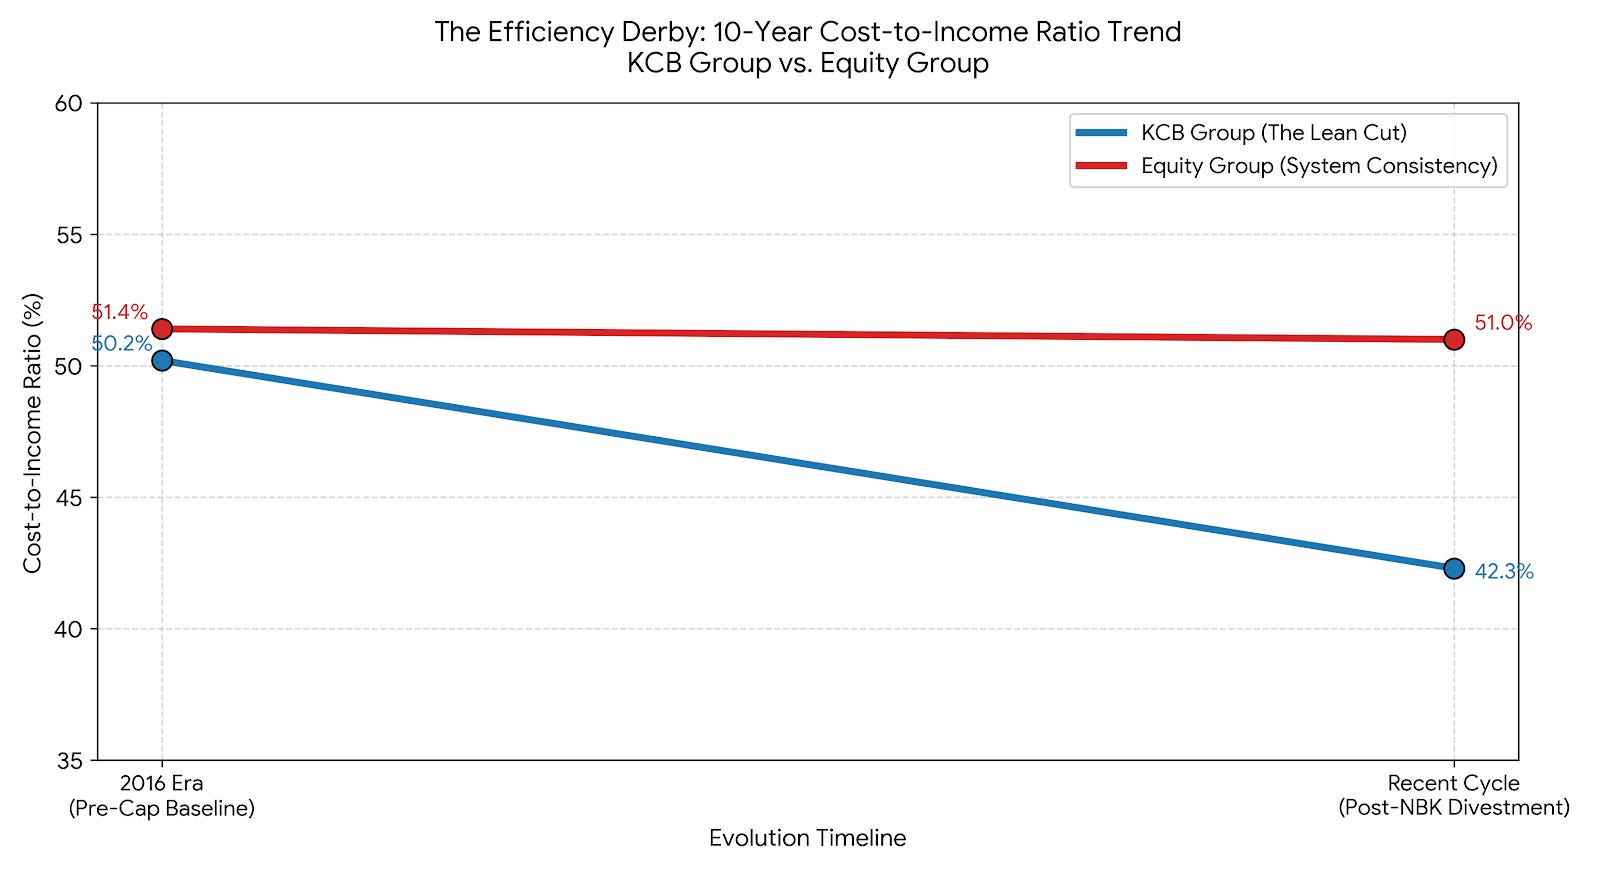
Here is the trend curve charting the Cost-to-Income Ratio (CIR) evolution between the two banking models across the decade.
The Structural Efficiency Breakdown:
Equity’s System Consistency (The Red Line): Equity has maintained a remarkably stable operational midfield, holding steady around the 51% mark. This stability represents a deliberate tactical choice: as they aggressively scale digital transactions—which dramatically drives down transaction costs—they continuously reinvest those savings back into building out complex pan-African regional subsidiaries (like the DRC) and expanding infrastructure. It is a highly consistent, self-funding system.
KCB’s Structural Lean Cut (The Blue Line): KCB started the decade at 50.2%, but has successfully managed an aggressive drop down to 42.3% in the recent cycle. While their heavy corporate focus yields larger lump-sum revenue pools per transaction, the true catalyst for this sharp curve downward was a decisive management maneuver: the divestment and final sale of National Bank of Kenya (NBK). Slicing away that high-cost retail legacy instantly trimmed KCB’s overall operational weight, making them a leaner, asset-light machine on paper.
4. The Defensive Line: NPL Management
The Battle of the Backline: A 10-Year Forensic of KCB vs. Equity’s NPL Journey
If generating net interest income and non-funded revenue is a bank’s attacking frontline, managing Non-Performing Loans (NPLs) is its central defense. A bank can score as many operational goals as it wants, but if its backline is leaky, provisions will tax its bottom line and dilute shareholder returns.
When analyzing the 10-year structural trajectory of Kenya’s two banking titans—KCB Group and Equity Group—the divergence in their asset quality control is one of the most compelling chapters of their rivalry. One has consistently relied on a corporate, heavy-shield defense that is vulnerable to systemic counter-attacks, while the other built a dynamic, small-ticket zonal press designed to absorb macroeconomic shocks.
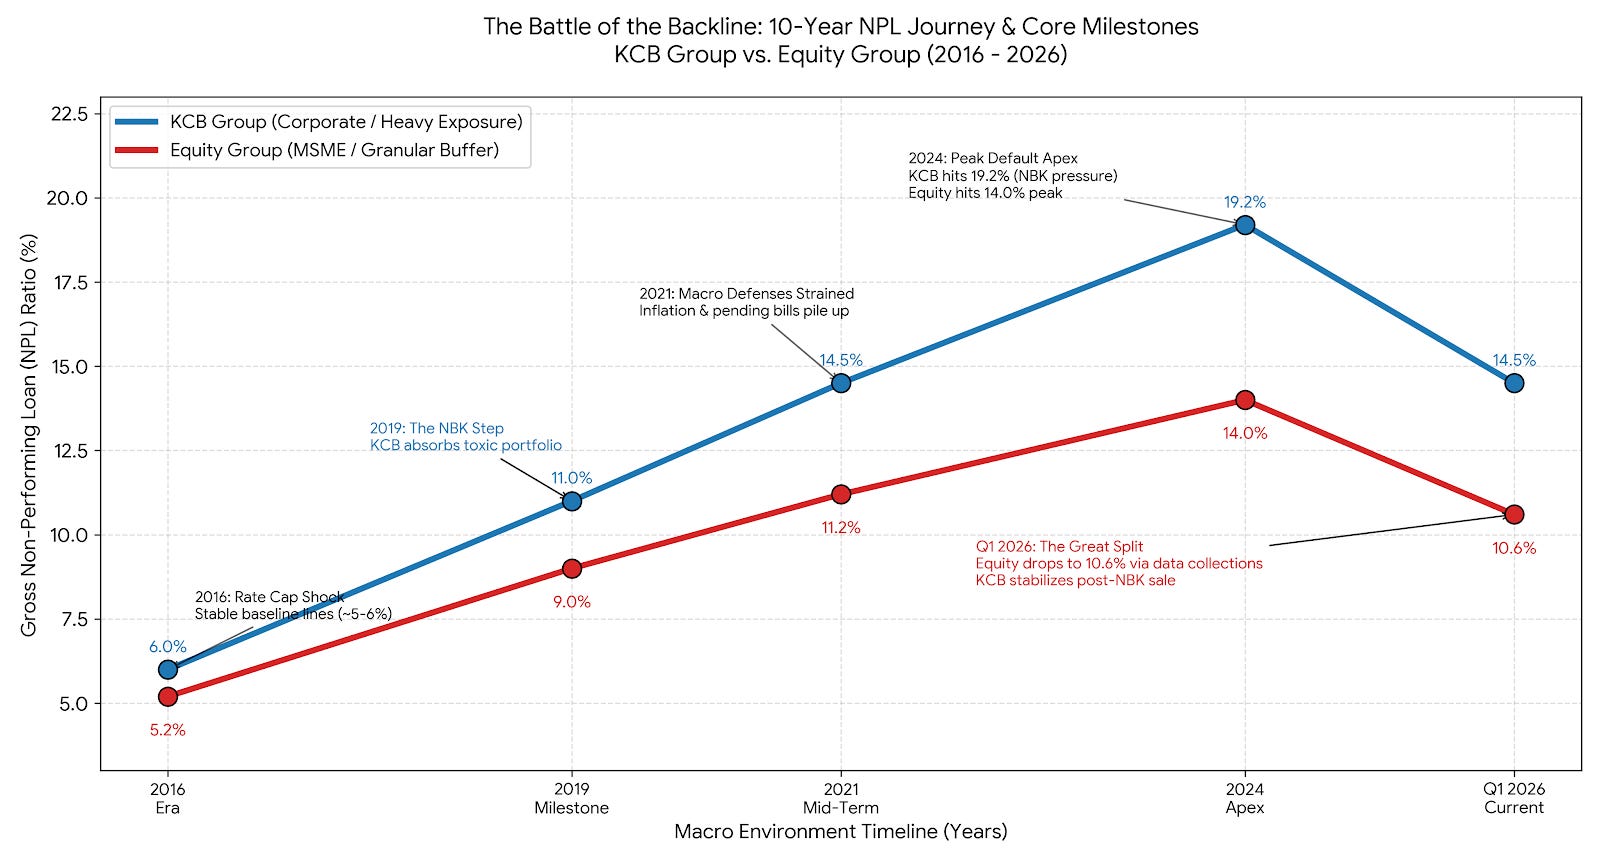
Here is the 10-year trend curve mapping the asset quality and Non-Performing Loan (NPL) journeys of both banking groups, explicitly calling out the key inflection points that redefined their balance sheet defenses.
The Structural Insights from the Curves:
The 2019 NBK Divergence: Notice the sharp upward trajectory on KCB’s blue line starting in 2019. This marks the moment they absorbed the distressed National Bank of Kenya portfolio, introducing an intentional structural drag into their backline defensive metrics.
The 2024 Apex: This represents the height of the macroeconomic credit strain in East Africa (currency deprecation, inflation, and public sector pending bills). KCB’s heavy corporate layout saw bad loans peak at 19.2%, while Equity’s MSME model also maxed out its local stress test at 14.0%.
The Great Q1 2026 Split: Look at the rightmost drop on the timeline. Equity’s “zonal press” data collections model cleared out toxic positions down to 10.6%. Meanwhile, KCB successfully bent its curve downward by divesting its high-cost corporate legacy through the final sale of NBK to Access Bank, returning its book to a cleaner operational footing.
4a. The Philosophies: Heavy Corporate vs. MSME Zonal Press
To understand why their asset quality lines look the way they do today, we have to examine the baseline DNA of their loan books:
KCB Group (The Heavy Corporate Shield): KCB’s heritage is rooted in large-scale corporate credit, public sector financing, and massive structural projects. When they deploy capital, they do it in massive lump sums. While this allows them to scale their loan book rapidly, it exposes their defensive line to concentrated risk. If one or two major corporate accounts in manufacturing, transport, or real estate suffer a macroeconomic blow, the entire group’s NPL ratio spikes instantly.
Equity Group (The MSME Zonal Press): Equity engineered its lending model around micro, small, and medium enterprises (MSMEs), agriculture, and retail consumer credit. Instead of lending KES 5 billion to a single counterparty, Equity spreads that same KES 5 billion across tens of thousands of small businesses. When a macro crisis hits, individual defaults occur, but the granular distribution of the book prevents a catastrophic, single-point breach of their defensive line.
4b. Chronology of the Crisis Points (2016–2025)
The 2016 Rate Cap Shocks
When the interest rate cap was enacted in late 2016, it acted as a sudden stress test for both defensive systems.
Equity’s Choice: They immediately began choking back credit supply to risky MSMEs, choosing instead to hoard liquidity in government securities and pivot aggressively toward digital rails. This kept their NPLs structurally subdued but slowed down their loan book momentum.
KCB’s Choice: KCB used its corporate muscle to absorb the shock, continuing to lend heavily to large institutions. While this preserved their absolute asset dominance, it left them holding a complex array of long-term corporate credit facilities that would become highly sensitive to future currency and inflation shocks.
The Pandemic & The Sovereign Debt Super-Cycle (2020–2023)
The true divergence crystallized between 2020 and 2023. As inflation spiked, the Kenya Shilling depreciated rapidly, and government pending bills accumulated, corporate defaults surged across East Africa.
KCB’s corporate backline buckled under the weight of large-scale legacy defaults, particularly in the manufacturing, construction, and real estate sectors. Compounding this was KCB’s strategic acquisition of National Bank of Kenya (NBK), a legacy state-linked lender that carried a severely distressed credit portfolio with NPL ratios frequently exceeding 30%. By FY 2024, KCB’s gross NPL ratio had deteriorated to a sticky 19.2%, forcing the group to aggressively take KES 30 billion in loan loss provisions to shore up its balance sheet defense.
Equity was not immune to the macro environment. Their gross NPL ratio climbed to 14.0% by early 2025. However, Equity relied heavily on data analytics and automated early-warning tracking across their digital channels. Instead of holding onto toxic, asset-heavy corporate credit, they utilized their high operating cash flow to aggressively execute write-offs and restructure small-business facilities while ramping up their IFRS coverage.
4c. The 2026 Reality: Clean Sheets vs. Restructuring Recovery
The just-released Q1 2026 earnings results show exactly how these two distinct asset quality journeys have culminated:
Equity’s Clean Sheet Focus: Equity pulled off an impressive defensive cleanup, knocking its Group NPL ratio down sharply from 14.0% to 10.6% year-on-year. Backed by an 18% reduction in loan loss provisions and a strengthened NPL coverage ratio of 72%, Equity’s risk engine demonstrated that its MSME-led, data-driven collections model could heal much faster than traditional corporate books when macro pressures ease.
KCB’s Tactical Backline Rebuild: KCB is executing a massive structural overhaul. The defining move was completing the divestment and sale of NBK, which instantly purged a massive concentration of bad legacy loans from the Group balance sheet. While KCB’s gross NPL profile remains in a stickier 14% - 15% range due to lingering defaults in its large-scale Kenyan corporate manufacturing and trade portfolios, their post-NBK operational core is significantly lighter.
The Investor’s Takeaway
KCB’s historical corporate lending strategy means their asset recovery requires time-consuming corporate restructuring, debt-to-equity swaps, or large-scale collateral liquidations. Equity’s digital, high-velocity model allows them to cycle through credit cycles much faster. Equity’s ability to clean its backline at a pace 50% faster than KCB is exactly why the market rewards “The Process” with a premium valuation multiple.
5. The Pan-African Stage: Entry Strategies, Scale, and the Country-by-Country Derby
The real battlefield for supremacy between KCB Group and Equity Group has shifted beyond Kenya’s borders. With the domestic market highly saturated, both giants have spent the last decade positioning themselves to capture the immense, unbanked liquidity of the wider East and Central African region.
However, their methods for capturing the continent differ fundamentally. One relies on tactical asset consolidation, while the other leans into organic ecosystem conversion.
5a.The Entry Philosophy: Acquisitive Scale vs. Blueprint Re-engineering
The contrasting playbooks we see on their balance sheets are perfectly mirrored in their pan-African expansion strategies.
KCB Group: The Big-Ticket Acquisitive Model
KCB’s regional entry model is explicitly asset-heavy and institutional. They expansion-hunt by identifying large, well-established local players with deep corporate or sovereign roots and buying outright control.
The Blueprint: Think of their major moves—absorbing Rwanda’s Banque Populaire du Rwanda (BPR) to form BPR Bank Rwanda, and acquiring a massive 85% stake in Trust Merchant Bank (TMB) in the Democratic Republic of Congo (DRC).
The Play: This gives KCB instant, massive market share, immediate infrastructure, and a heavy corporate deposit base on day one. The trade-off is that they inherit deep legacy costs, physical networks, and complex institutional integration timelines.
Equity Group: The Scalable Blueprint Re-engineering
Equity treats cross-border expansion as a software installation. They look for existing entry points, but once inside, they aggressively dismantle and rebuild the acquired bank to mirror their Kenyan digital-and-agency retail model.
The Blueprint: When Equity entered the DRC by acquiring ProCredit and merging it with Banque Commerciale du Congo (BCDC) to form Equity BCDC, they didn’t preserve its old identity. They instantly deployed their low-cost retail agency rails and aggressive tech stack.
The Play: They turn foreign entities into highly centralized, digital deposit-mobilization engines. This allows them to scale transactional volume exponentially without dragging physical brick-and-mortar overhead across borders.
5b. Consolidated Subsidiary Performance: The Tipping Point
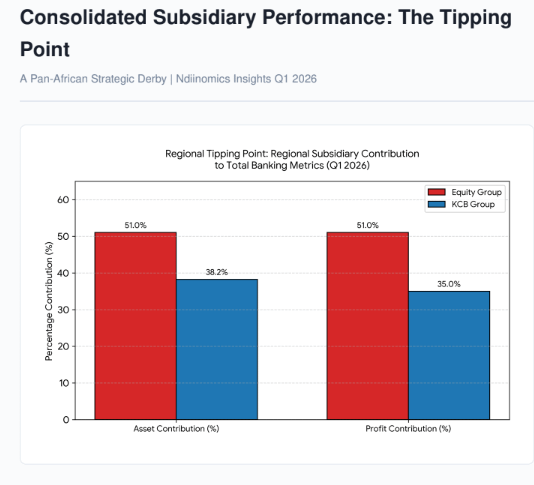
The financial rewards of these strategies have reached a dramatic historic milestone. For the first time, the earnings engine has structurally tilted away from Nairobi.
Consolidated Subsidiary Financial Performance (Q1 2026)
The Regional Split
Equity is now a truly regional bank that happens to be headquartered in Kenya. With international subsidiaries driving half of all banking assets and net profits, Equity has successfully insulated its shareholders from localized Kenyan sovereign risks and currency devaluations.
KCB remains structurally anchored to its Kenyan home turf. While their international units are performing remarkably well—with their contribution to profits climbing to 35% (up from 17.2% a few cycles ago)—the domestic unit still carries the bulk of the group’s weight.
3. Country-by-Country Derby: The Regional Scorecard
When we zoom in to look at individual borders, the specific competitive dynamics reveal where the real cash is being generated.
                  [REGIONAL EARNINGS POWER - Q1 2026]

   DRC CONGO   ── Equity BCDC (32% PAT Growth) ➔ Highly dollarized retail monster.
               ── KCB TMB (KES 1.9B PBT baseline) ➔ Industrial & trade finance heavyweight.

   RWANDA      ── Equity Rwanda (36% PAT Growth) ➔ Hyper-digital ecosystem play.
               ── KCB BPR Bank ➔ Mass scale via legacy physical network integration.

   TANZANIA    ── Equity Tanzania (150% PAT Growth Apex) ➔ The breakout star of the quarter.
               ── KCB Tanzania ➔ Standard corporate & trade corridor play.
a. The Democratic Republic of Congo (The Crown Jewel)
The DRC has become the ultimate testing ground for pan-African banking. The market is vastly underbanked, heavily dollarized, and yields massive margins.
Equity BCDC: Equity’s unit is an absolute money printer, registering an impressive 32% year-on-year surge in Profit After Tax (PAT) for Q1 2026. By deploying over 86,000 regional agency outlets and digital pipelines across the country, Equity has unlocked ultra-low-cost retail deposits that it channels into highly lucrative local lending and liquid foreign assets.
KCB TMB: KCB’s Trust Merchant Bank (TMB) provides massive scale, contributing roughly 14% to KCB’s total asset footprint. It serves as a formidable corporate powerhouse, bringing in KES 1.9 billion in Profit Before Tax (PBT) early in the cycle. However, because it relies on a more traditional corporate design, its transactional velocity lacks the compounding explosive speed of Equity’s retail framework.
b. Rwanda (The Efficiency Play)
Rwanda represents a mature, highly competitive digital economy where operational efficiency dictates survival.
Equity Rwanda: Logged a strong 36% PAT growth in Q1 2026. It operates almost entirely as a cashless, tech-led ecosystem, squeezing maximum fee income out of merchant networks and mobile integrations.
KCB BPR Bank: Following KCB’s merger of its original unit with Banque Populaire du Rwanda, KCB commands a massive physical presence in the country. While it gives them unmatched local reach and a massive base of retail customers, it demands constant operational optimization to keep structural costs from eating into margins.
c. Tanzania (The Breakout Star)
Equity Tanzania: Emerged as the undisputed breakout performer of the Q1 2026 cycle, posting a staggering 150% explosion in Profit After Tax. This hyper-growth marks the exact moment Equity’s local agency distribution network reached critical mass, allowing them to scale customer acquisition without incurring matching capital expenditures.
KCB Tanzania: Operates a steady, conservative business focused on regional trade corridors and corporate banking along the Dar es Salaam port network, yielding reliable but linear growth lines.
The Sultan’s Forensic Summary
In the pan-African derby, KCB built an empire, but Equity built a network.
KCB’s strategy of buying large, asset-heavy corporate operations gives them a massive, imposing physical presence across East Africa. However, Equity’s ability to seamlessly drop its tech blueprint across borders has allowed its international subsidiaries to achieve deep operating leverage.
When your regional subsidiaries outside your home market begin contributing over 50% of your entire banking asset and profit base, you are no longer just vulnerable to local headwinds. You have built a diversified, multi-currency shield that guarantees high-velocity growth, regardless of the terrain.
6. The Shadow Derby: Fintech, Underwriting, and the Non-Banking Power Play
The battle between KCB Group and Equity Group has officially evolved beyond banking assets and cross-border geographical expansion. Both giants are now competing on a brand-new frontier: bancassurance, investment banking, and fintech payments.
As of the just-released Q1 2026 earnings cycle, non-banking subsidiaries are emerging as critical engines for diversified non-funded income (NFI).
6a. The Insurance Duel: The “Third Engine” vs. The Brokerage Model
The most aggressive expansion outside traditional banking is happening in insurance, where the two groups deploy completely different operating setups.
Equity Insurance Group: The Full-Underwriter Powerhouse
Equity has intentionally moved away from functioning purely as an insurance intermediary. They built a fully fledged underwriting ecosystem comprising three distinct entities: Life, General, and Health Insurance.
Q1 2026 Performance: Equity’s insurance wing is growing at a phenomenal velocity, with Group CEO Dr. James Mwangi declaring it a official “third engine of growth” alongside banking and payments.
tradingroom.co.ke
The Numbers: In Q1 2026 alone, Equity’s combined insurance units pulled in KES 4.46 billion in Gross Written Premiums (GWP), representing a 30% year-on-year growth.
kenyanwallstreet.com
Profitability: The segment’s Profit Before Tax (PBT) expanded by 53% to KES 636 million. Equity Life Assurance Kenya has scaled aggressively, capturing 12.1% of Kenya’s Group Life and Credit Life market share by leveraging its massive base of 22.7 million banking clients.
kenyanwallstreet.com+ 1
The Product Split:
Life Insurance: KES 2.7 billion
www.businessquest.co.ke
Health Insurance: KES 1.2 billion
www.businessquest.co.ke
General Insurance: KES 0.6 billion
www.businessquest.co.ke
KCB Insurance Agency: The Distribution Play
KCB has historically approached insurance through an asset-light, agency-bancassurance model rather than full underwriting.
The Setup: Instead of taking underwriting risks onto its own balance sheet, KCB utilizes its extensive regional network to sell third-party insurance products, collecting high-margin commission and service fee income.
The Play: While this protects KCB from direct claims liabilities, it limits their capacity to compound premium float at the explosive scale Equity is demonstrating. To counter this, KCB is actively restructuring its bancassurance infrastructure across its newly integrated subsidiaries (like BPR Bank Rwanda and TMB Congo) to unlock similar cross-selling capacity.
6b. Fintech & Payments: The Internal Rail vs. Merchant Aggregation
Digital transactional processing is where the operating leverage of both groups is truly won or lost.
[FINTECH PLATFORM ARCHITECTURE]

Equity Group (Ecosyste                      m Internalization)
➔ 98.3% of transactions occur outside branches; ~90% on pure digital rails.
➔ Digital lending revenues reached KES 3.0 billion in Q1 2026 alone.

KCB Group (The Full Merchant Stack)
➔ Processing KES 151 billion in mobile loans in Q1 2026 (KES 1.7 billion/day).
➔ Completing merchant rails via acquisitions of Riverbank & Pesapal.
Equity’s Ecosystem Internalization
Equity treats fintech as an integrated internal architecture. In Q1 2026, an astonishing 98.3% of all customer transactions occurred outside physical branches, with nearly 90% processed entirely via their digital channels.
The Monetization: Rather than letting external payment aggregators clip the ticket, Equity internalizes the fee income. This strategy drove a 26% increase in digital lending revenue to KES 3.0 billion in Q1 2026 alone, demonstrating how effectively they can monetize small-ticket, instant credit via data analytics.
kenyanwallstreet.com
KCB’s Full-Stack Merchant Aggregation
KCB’s fintech model is an absolute volume monster, but it is architected differently. Their digital lending engine is heavily integrated into mobile telco partnerships and native apps.
The Volume: In Q1 2026, KCB’s mobile loan disbursements hit an eye-watering KES 151 billion. That scales out to roughly KES 1.7 daily billion disbursed on mobile credit, acting as the primary spine for retail credit growth.
tech-ish.com
The Payment Grid Play: KCB is building out an aggressive, independent merchant ecosystem. Their investor disclosures confirm they are processing the regulatory clearances to secure a minority stake in Pesapal. Combined with their majority stake in Riverbank Solutions, KCB is systematically assembling a proprietary payment and merchant aggregation stack to lock down small-and-medium enterprise (SME) payment corridors across East Africa.
tech-ish.com
6c. Wealth Management & Investment Banking
KCB Investment Bank (KCBI)
KCB maintains a highly formidable, institutional presence on the Nairobi Securities Exchange (NSE) and regional capital markets via KCB Investment Bank. KCBI consistently ranks as a lead transaction advisor for large-scale corporate bond issuances, sovereign debt structuring, and heavy institutional asset management, feeding directly into KCB’s historical corporate-heavy strengths.
Equity Investment Bank (EIB) / Wealth Management
Equity has traditionally deployed its investment banking arm to handle advisory roles, but they have recently pivoted aggressively toward retail wealth management and specialized structures. They focus on democratizing access to capital market instruments for their premium retail and diaspora clients, matching their established mass-market philosophy.
The Sultan’s Non-Banking Verdict
Equity is successfully turning itself into an all-inclusive financial supermarket. By owning the underwriter (Equity Insurance Group) and the tech rails, they retain 100% of the customer’s financial wallet share. The 53% surge in insurance PBT is clear evidence that this diversification strategy is expanding their operating margins.
KCB is playing a high-volume transactional infrastructure game. Disbursing KES 1.7 billion a day in mobile loans and wrapping a full payment processing ecosystem (Pesapal + Riverbank) around their commercial lending book shows they want to control the physical flow of merchant money across the continent.
The Portfolio Allocation Play: Equity’s non-banking units provide immediate, high-margin fee income that shields the group from banking-sector interest rate cycles. KCB’s merchant payment plays are long-term structural infrastructure bets that will pay off massively once fully integrated into their cross-border banking rails.
To truly assess the executing power of these two financial giants, we must look past the Group CEOs and perform a forensic audit on the generals commanding the critical operational lines.
Here is the strategic comparison of the senior leadership benches driving KCB Group and Equity Group across their core execution verticals.
a. Group Chief Executive Officers (CEOs): Visionary Founder vs. Corporate Fixer
Equity Group: Dr. James Mwangi (Group CEO)
Profile & Track Record: Mwangi is the institutional architect of modern mass-market banking in East Africa. Having helmed Equity for over three decades, his leadership is defined by an ideological, founder-led conviction. His core strength is an unmatched ability to accurately anticipate long-term macroeconomic shifts.
Execution Style: Highly centralized. Mwangi acts as a strategic master builder who tightly governs the group’s pan-African scaling blueprint and high-velocity digital initiatives.
KCB Group: Paul Russo (Group CEO)
Profile & Track Record: Appointed in 2022, Russo is a pragmatic, process-driven professional executive. His legacy is defined by corporate restructuring, asset optimization, and a clinical focus on human capital. His defining masterstroke was orchestrating the strategic divestment and sale of National Bank of Kenya (NBK), decisively removing a major legacy drag from KCB’s balance sheet defense.
Execution Style: Decentralized and highly collaborative. Russo focuses on ruthlessly trimming operational fat while empowering his localized managing directors to run their respective territories.
b. Chief Operating Officers (COOs): Structural Scaling vs. Operational Integration
Equity Group: The Regional Matrix Structure
Equity Group: Samuel Kirubi (Group Chief Operating Officer)
Profile & Experience: Kirubi is a home-grown corporate general who deeply understands the execution DNA of the group. Having previously served as the Managing Director of Equity Bank Uganda and Equity Bank Rwanda, he brings hands-on, cross-border battlefield experience to the Group COO desk.
Strategic Focus: Scaling the regional footprint and stabilizing efficiency. Kirubi’s mandate is to ruthlessly oversee the group’s regional operational ecosystem. His frontline experience is vital in ensuring that as individual subsidiaries expand, they seamlessly transition into high-velocity, low-cost digital and agency banking rails without throwing off the group’s overall efficiency.
KCB Group: Appollos Mboya (Group Chief Operating Officer)
The Setup: KCB utilizes a centralized, dedicated Group COO vertical to manage its vast physical and digital footprint across East Africa.
Strategic Focus: Driving cross-border integration and efficiency. Mboya’s office is tasked with standardizing operations across massive, heavy physical networks—such as aligning Banque Populaire du Rwanda (BPR) and Trust Merchant Bank (TMB) in the DRC with the core Nairobi hub—while driving the group’s aggressive cost-cutting mandates.
c. Group Finance Directors: Capital Allocation vs. Value Unlock
Equity Group: Stephen Owuyo (Group Finance Director)
Profile & Experience: Owuyo is an elite Tier-1 financial control specialist who stepped into the Group Finance Director role. He brought highly relevant pan-African experience from Absa Group (where he was Director & Financial Controller for Absa Regional Operations across 9 countries) and Ecobank Transnational Incorporated in Togo.
Strategic Focus: Multi-currency optimization, cross-border financial governance, and structural efficiency. With international subsidiaries now printing 51% of total group assets and net profits, Owuyo’s deep experience managing complex IFRS compliance and regional banking control frameworks across sub-Saharan Africa is a massive asset for buffering Equity’s multi-currency earnings against regional volatility
KCB Group: Lawrence Kimathi (Group Chief Financial Officer)
Strategic Focus: Balance sheet optimization, provisioning management, and deep value unlock.
Execution Track Record: Kimathi is a seasoned Tier-1 fiscal disciplined veteran. His desk has been the frontline engine behind KCB’s dramatic drive down to an ultra-lean 42.3% cost-to-income ratio. He has successfully balanced heavy, multi-billion-shilling loan loss provisioning requirements while reallocating capital liberated from the NBK liquidation back into high-yielding corporate and trade-finance assets.
d. Risk Management Leadership: Portfolio Granularity vs. Institutional Mitigation
Equity Group: The Predictive MSME Credit Engine
The Philosophy: Spreading risk across millions of micro, small, and medium enterprises (MSMEs) and digital retail borrowers.
Execution Track Record: Equity’s risk leadership operates a data-driven, early-warning risk framework. By leveraging predictive behavior analytics across mobile loan books, they managed to sharply compress the Group NPL ratio from 14.0% down to 10.6% in the recent cycle. They prioritize high provisioning coverage and rapid asset write-offs to maintain a clean, high-velocity book.
KCB Group: The Heavy Corporate Credit Defense
The Philosophy: Mitigating large-scale, structural corporate exposure, public-sector facilities, and cross-border trade finance lines.
Execution Track Record: KCB’s risk desk deals with highly complex, long-gestation restructurings, debt-to-equity swaps, and intensive sovereign debt modeling. Following the elimination of the volatile NBK asset book, KCB’s risk leadership has successfully stabilized their defensive backline around the 14% - 15% NPL zone, systematically working to cure lingering defaults within Kenya’s manufacturing and infrastructure sectors.
e. Technology & Fintech Leadership: Ecosystem Internalization vs. Merchant Rails
Equity Group: Pure Tech Infrastructure Replication
The Philosophy: Treating tech as the core commercial pipeline. Equity internalizes its payment systems so that 98.3% of all customer transactions occur entirely outside physical branches.
Execution Track Record: Equity’s technology leadership focuses on infinite scalability. They ensure their centralized core banking engine seamlessly runs over 86,000 regional agency outlets and massive digital lending channels—which alone brought in KES 3.0 billion in Q1 2026 digital credit revenue—capturing 100% of the customer’s wallet share without relying on external aggregators.
KCB Group: High-Volume Transactional Aggregation
The Philosophy: Controlling the physical flow of merchant and telco-driven money across the continent.
Execution Track Record: KCB’s digital tech engine is an absolute volume monster, engineered to support massive, high-capacity pipelines. Their platforms seamlessly process an incredible KES 151 billion in mobile loans per quarter (averaging KES 1.7 billion daily). Furthermore, their tech leadership is actively building out an independent, full-stack merchant payment infrastructure by strategically integrating external payment platforms like Pesapal and Riverbank Solutions directly into KCB’s commercial framework.
The Sultan’s Bench Verdict
Equity’s Senior Team functions like a high-conviction tech startup operating at banking scale. Under Mwangi’s visionary umbrella, the finance, operations, and tech verticals are hyper-optimized to replicate a highly profitable digital template across African borders at breakneck speed.
KCB’s Senior Team functions like a powerhouse corporate military cabinet. Russo, Kimathi, and Mboya are elite corporate turnaround artists who excel at structural optimization, complex asset cleanups, managing colossal transactional volumes, and turning massive physical acquisitions into lean operating machines.
The Portfolio Play
Back Equity for the Visionary Alpha: If you believe the future of banking belongs to high-velocity, digital-first ecosystems that aggressively claim cross-border markets, you trust Dr. James Mwangi’s proven ability to out-innovate the competition.
Back KCB for the Operational Execution: If you prefer an institutional layout where professional executioners like Paul Russo can ruthlessly trim fat, divest underperforming assets, and optimize corporate banking corridors, you buy KCB for its predictable structural resilience.
The Valuation Verdict
When the final whistle blows on a decade of competition, the numbers tell an undeniable story:
KCB won the raw volume race. They retain the crown for the absolute largest customer deposit volume and loan book deployment in East Africa. When they want to leverage balance sheet mass, nobody moves money like them.
Equity won the valuation and efficiency derby. By generating KES 75.5 billion in net profit for FY 2025 compared to KCB’s KES 68.4 billion, Equity proved that high-velocity digital rails can out-yield raw balance-sheet mass.
equitygroupholdings.com
Investors on the Nairobi Securities Exchange (NSE) routinely pay a premium for Equity’s repeatable, digital architecture over KCB’s heavy corporate capital deployments. KCB plays like City—built on massive, expensive squad depth that can overwhelm any opponent on its day. But as the 10-year data shows, when you consistently trust a highly optimized digital process, you don’t just win games; you completely redefine how the league is played.