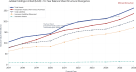

As Johannesburg pushes a unified corporate vision and local leadership shifts, rate cuts and a 10% profit drop test whether the pan-African playbook fits Nairobi’s reality. Between Kenny Fihla’s CIB push and a local leadership handover, a 150% dividend hike masks structural questions about Absa Kenya’s role in the group’s pan-African agenda.
I. Introduction: Kenny Fihla’s Grand Strategy vs. The Ground Reality in Absa Kenya
When Kenny Fihla took the reins as Absa Group CEO, the mandate from Johannesburg was clear: transform Absa into a unified, high-margin CIB powerhouse across Africa. The corporate playbook envisioned seamless trade rails connecting South Africa to regional growth hubs like Kenya, extracting higher returns and building scale to challenge regional heavyweights.
However, the H1 2026 financial results present a sharp divergence between Group ambition and local execution. While Johannesburg reported an 8% gain in Group headline earnings driven by its South African retail and wholesale operations, its local subsidiary—Absa Bank Kenya PLC—collided with a changing local macro environment.
For investors on the Nairobi Securities Exchange (NSE), the headline numbers created an interesting contrast:
The Top-Line Slowdown: Absa Bank Kenya posted a 10% drop in Profit After Tax to KSh 10.5 billion (down from KSh 11.7 billion in H1 2025).
The Shareholder Reward: Despite falling net profits, the Board declared a 150% surge in its interim dividend to KSh 0.50 per share (up from KSh 0.20).
This analysis breaks down how Central Bank of Kenya (CBK) rate cuts, a strengthening Shilling, and local balance-sheet re-engineering shaped Absa Kenya’s H1 2026 performance.
II. Geographic Divergence: South Africa Parent vs. Africa Regions
The overall Absa Group results show a clear geographic split. While domestic operations in South Africa delivered steady growth, the broader Africa Regions division felt the impact of central bank rate-cutting cycles across East and West Africa.
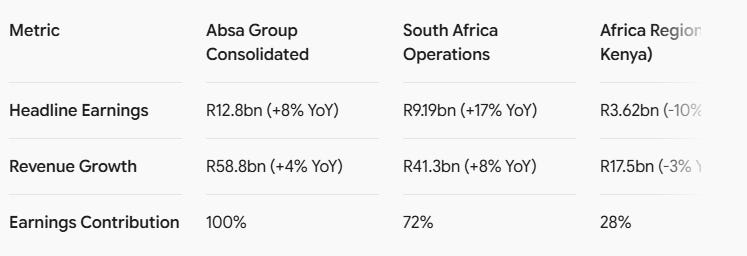
Core Drivers of the Regional Pull-Back
Monetary Easing Squeeze: Central banks in key regional hubs—notably the CBK in Kenya and the Bank of Ghana—lowered benchmark rates to stimulate local private sector credit. This reduced average asset yields faster than banks could lower deposit liabilities.
FX Margin Normalization: The wide bid-ask FX spreads and trading gains that boosted non-interest revenue during the volatile 2024–2025 period normalized, creating a tough baseline comparison for regional trade desks.
III. Absa Bank Kenya: Top-Line Pressure vs. Balance Sheet Realignment
In Nairobi, Absa Bank Kenya’s income statement reflected the local rate cycle. Net Interest Income (NII) contracted 5% YoY as average lending yields eased from over 17% in late 2024 to 14.3% in H1 2026.
Financial Highlights (H1 2026)
Net Interest Income: KSh 21.1 Billion (-5% YoY)
Non-Funded Income (NFI): KSh 8.2 Billion (-10% YoY, driven by lower FX revenue)
Total Revenue: KSh 29.3 Billion (-7% YoY)
Profit Before Tax (PBT): KSh 14.2 Billion (-16% YoY)
Profit After Tax (PAT): KSh 10.5 Billion (-10% YoY)
                     [ ABSA KENYA H1 2026 REBALANCE ]
                                    │
       ┌────────────────────────────┴────────────────────────────┐
       ▼                                                         ▼
[ Yield & Margin Compression ]                         [ Balance Sheet Strength ]
 • Net Interest Income: KSh 21.1B (-5%)                 • Customer Assets: KSh 329.9B (+8%)
 • Non-Funded Income: KSh 8.2B (-10%)                   • Customer Deposits: KSh 380.7B (+5%)
 • Average Lending Yield: 14.3%                         • CASA Ratio: 75% of total deposits
 • Total Revenue: KSh 29.3B (-7%)                       • Interim Dividend: KSh 0.50 (+150%)
Under-the-Hood Execution: What the Topline Hides
Despite compressed earnings, Absa Kenya strengthened several core operational metrics:
Cost of Funds Advantage: Absa pushed its Current and Savings Account (CASA) mix to 75% of total customer deposits (KSh 380.7 billion total deposits). This reduced its overall cost of funds to 2.8%—well below the Kenyan banking sector average of 3.8%.
Asset Quality Rehabilitation: Gross Non-Performing Loans (NPLs) dropped significantly, bringing the bank’s NPL ratio down to 10.1%. This comfortably outperforms the broader Kenyan banking industry NPL average of ~14.6%, backed by a 69% NPL coverage ratio.
Balance Sheet Expansion: Customer lending grew 8% YoY to KSh 329.9 billion, while total assets rose to KSh 558.1 billion.
Return on Capital: Absa Kenya generated a 21.7% Return on Equity (ROE) and maintained a Core Capital Ratio of 21.4% (against the statutory minimum of 10.5%), giving the board room to increase the interim dividend to KSh 0.50.
IV. Analytical Critique: Parent Ambition Meets Local Market Realities
The local performance highlights three primary dynamics shaping foreign-owned Tier-1 lenders in Kenya:
                   [ THE KENYAN MARGIN COMPRESSION TRIAD ]
                                    │
      ┌─────────────────────────────┼─────────────────────────────┐
      ▼                             ▼                             ▼
[ Asymmetric Rate Transmission ]   [ FX Volatility Windfalls ]   [ Heavy Tech Capex ]
 • CBK Benchmark Cuts Lower         • Shilling Stability Slashes  • KSh 1.47B Tech Investments
   Lending Rates Faster Than          Bid-Ask Spreads & Trading     Drive CIR to 41.2%
   Term Deposits Re-Price             Margins                       To Protect Digital Share
1. Asymmetric Interest Rate Transmission
When the CBK cuts its Central Bank Rate, Kenyan corporate and retail loans re-price downwards almost immediately. Fixed-term deposits, however, remain locked in at higher rates until maturity. Absa Kenya’s 8% loan expansion was not enough to offset shrinking interest margins during this lag.
2. The Post-FX Volatility Adjustment
During the foreign exchange volatility of 2024, Kenyan banks recorded high FX trading margins. As the Shilling stabilized throughout 2025 and early 2026, those wide spreads narrowed. Non-funded income fell 10% to KSh 8.2 billion as FX revenue normalized to historical levels.
3. Strategic Capex vs. Short-Term Cost Ratios
Johannesburg’s corporate strategy mandates digital transformation to capture retail and MSME transaction volumes. Absa Kenya absorbed KSh 1.47 billion in tech platform upgrades in H1 2026. While this pushed operating expenses up 6% to KSh 12.1 billion, it helped generate a 34% increase in digital channel revenues (KSh 1.12 billion) and KSh 14.8 billion in digital loan disbursements.
V. Bourse Takeaways & Bourse Outlook (NSE: ABSA)
Dividend Yield Cushion: Doubling the interim dividend to KSh 0.50 demonstrates strong capital adequacy (21.4% Core Capital) and provides cash yield support for institutional and retail investors on the NSE.
Structural Cost Advantage: Holding a 75% CASA deposit mix and a 2.8% cost of funds leaves Absa Kenya well-positioned to protect margins as local private sector credit demand recovers.
Credit Risk De-risking: Cutting the NPL ratio to 10.1% while maintaining an industry-leading ROE (21.7%) indicates that credit loss provisions will remain manageable through H2 2026.
Executive Conclusion
The 10% profit dip at Absa Bank Kenya is less about structural weakness and more about the impact of local rate cuts and FX normalization. By lowering its funding costs, improving asset quality, and maintaining a 21.7% ROE, Absa Kenya remains an efficient franchise navigating a changing monetary cycle.
About Boardlot Africa Research
Boardlot Africa is a premier financial intelligence and corporate governance publication dedicated to unpacking the mechanics of capital, market strategies, and structural shifts across East Africa’s corporate landscape. By bridging the gap between raw economic data and actionable market intelligence, we deliver deep-dive research, independent corporate analysis, and policy insights designed for institutional investors, boardrooms, and sharp market observers.
Get in Touch
Email: boardlot.research@gmail.com
Phone: +254 753 133 901
Substack: Subscribe to Boardlot Africa
X (Twitter): BoardLotSultan
Will the proposed draft guidelines have a similar impact as the crypto sector? When looking at the proposed changes how would you map out the changes?