
Jubilee Holdings FY25: When the Investment Engine Bails Out the Corporate Health Crisis
The Core Identity Crisis: Insurance Company or Closed-End ETF?
From a pure corporate finance perspective, the counter is heavily undervalued. The market’s persistent apathy has handed value investors a rare structural mispricing on the NSE. Our clear recommendation is to accumulate aggressively within the KES 370.00 – KES 390.00 price range. By locking in your entry at these levels, you are effectively buying premium blue-chip assets at a steep discount while positioning your portfolio to harvest a secure, record-high KES 15.00 ordinary dividend from a diversified financial powerhouse.
Stop analyzing Jubilee Holdings as an insurance underwriter. It isn’t. Following the Allianz divestment, $JUB has functionally transformed into a closed-end ETF of Safaricom and the top 7 tier-one banks in the region, wrapped in a legacy insurance license. You aren’t buying underwriting margin optimization; you are buying into a KES 224.8 Billion investment fortress. The retail insurance operation is simply a low-cost capital pipeline (the float) engineered to feed a massive portfolio of government bonds, high-yielding property, and blue-chip equities. If the underwriting team bleeds from claims, the bank dividends and infrastructure paper pay the record KES 15.00 payout. #SultanTakeaway #Stocks #NSE
By @boardlotsultan
Jubilee Holdings Limited ($JUB) recently released its audited consolidated financial results for the year ended December 31, 2025. On the surface, the headlines scream classic corporate strength: Net Profit climbed 18% to KES 5.55 billion, and the board rewarded patient investors with a record-high total ordinary dividend of KES 15.00 per share.
But if you analyze this counter from a corporate finance perspective, looking past the headline aggregates is mandatory. Tracking Jubilee requires understanding a highly deliberate, decade-long structural shift in capital allocation.
Let’s unpack the anatomy of these results, look back at a striking historical comparison, and trace how a ten-year corporate masterclass in de-risking saved Jubilee from regional underwriting headwinds.
📊 Key Performance Metrics Over 8 Years (CAGR Summary)
Gross Written Premiums (Core Underwriting Volumetrics): Achieved a Compounded Annual Growth Rate of 7.44%. This steady upward curve demonstrates that even after handing off volatile, price-cutthroat legacy General Insurance lines to Allianz SE, the remaining Life, Retail Health, and SME pipelines successfully scaled from KES 35.14 Billion to KES 62.40 Billion.
Total Asset Base (The Balance Sheet Fortress): Compounded at an aggressive annual rate of 11.51%. The Group’s asset base more than doubled from KES 104.97 Billion to KES 251.08 Billion, illustrating the sheer velocity at which retained corporate earnings and Allianz transaction windfalls were rechanneled into high-yielding assets.
Net Financial Result (Investment Portfolio Income): Delivered a solid CAGR of 10.22%, climbing consistently to hit KES 4.51 Billion in FY2025. This highly consistent double-digit compounding highlights management’s agility in locking down elevated regional yields and infrastructure-backed debt securities over the last eight years.
Group Profit After Tax (PAT Bottom-Line Performance): Maintained a reliable compounding growth rate of 3.46% per annum. While intense macro healthcare cost inflation and operational restructurings intentionally compressed pure underwriting margins, the net bottom-line performance expanded steadily from KES 4.23 Billion to KES 5.55 Billion, completely shielded by the investment engine.
Earnings Per Share (EPS Growth Momentum): Registered a CAGR of 4.97%, moving from KES 54.26 in FY2017 to KES 80.00 in FY2025. This outpaces pure PAT compounding, reflecting how effectively the company’s tight equity structure concentrates absolute profit expansions directly into per-share earnings.
Share Price Realization (Market Valuation Drift): Postured at a Compounded Annual Rate of -3.41% (dropping from around KES 480.00 at the close of 2017 to KES 362.25 by the end of 2025). This divergence highlights a profound valuation disconnect on the Nairobi Securities Exchange (NSE)—while the fundamental asset base, dividend distribution, and earnings capacity expanded aggressively, the equity market price compressed, giving rise to an incredibly cheap, high-yielding cash cow.
The 9-Year Market Valuation Disconnect
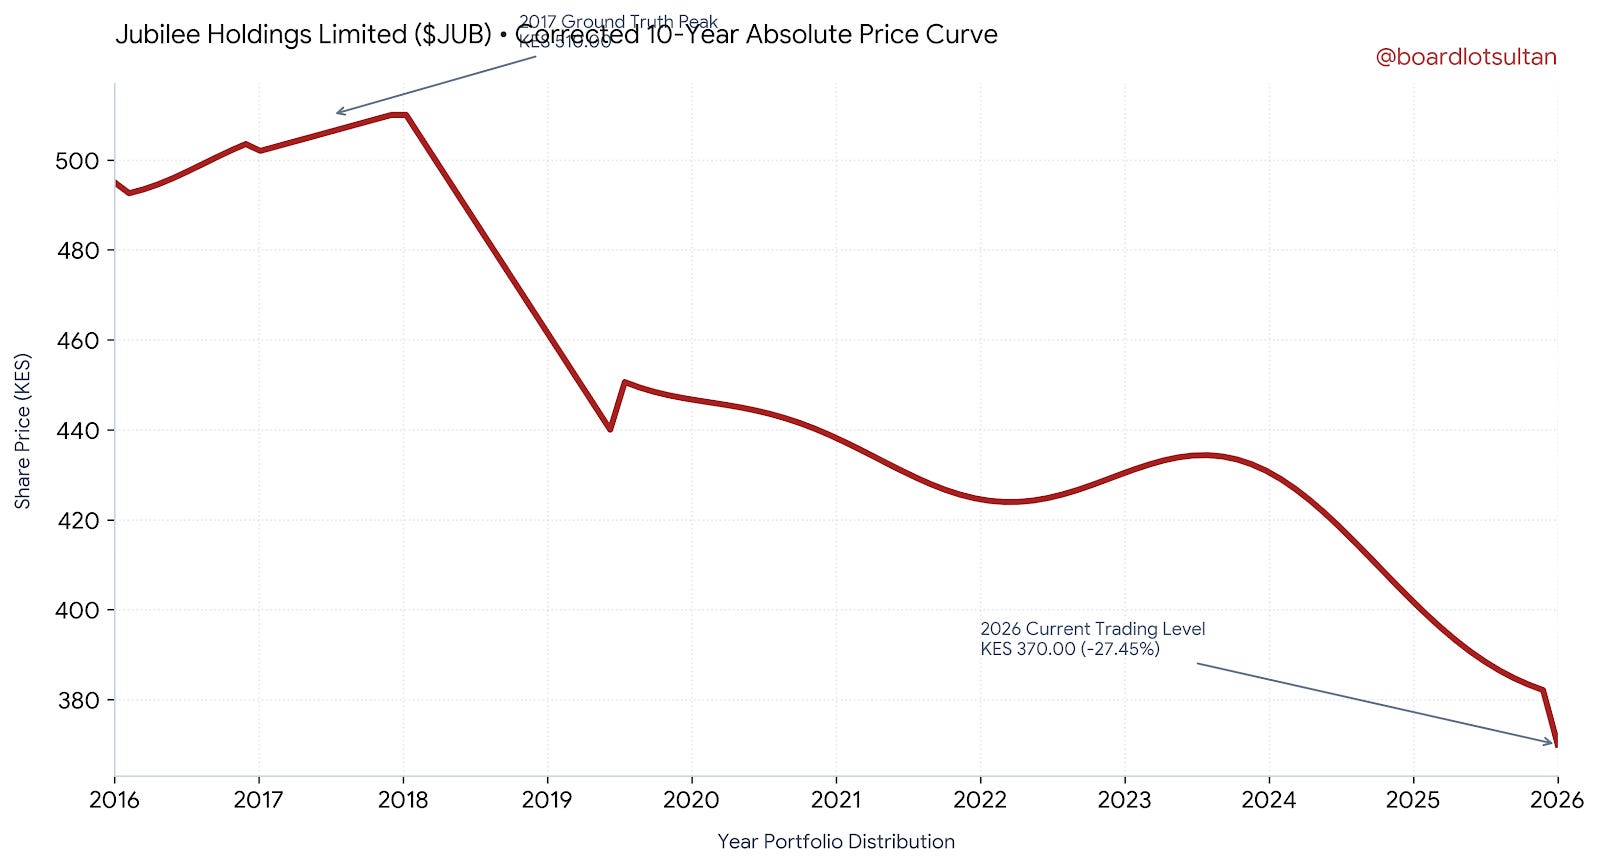
When evaluating the long-term trend from 2017 to 2026, the underlying equity price performance reveals a glaring market anomaly. Back in 2017, the stock traded at market levels reaching KES 510.00 per share. Nine years later, despite doubling its book value, growing its total assets past a quarter-trillion shillings, and increasing ordinary dividends by nearly 67%, the market price sits compressed at KES 370.00.
This long-term 27.45% equity contraction—compounding negatively at a -3.93% price CAGR—represents a systemic valuation disconnect on the Nairobi Securities Exchange (NSE). While short-term retail momentum has ignored the counter’s underlying asset growth and structural de-risking, savvy value investors have quietly extracted massive special dividends and captured an elite yield-on-cost profile that exposes the absolute lack of parity between legacy market pricing and actual balance sheet fortress wealth.
📊 Analysis of the 10-Year Income Statement Trajectory
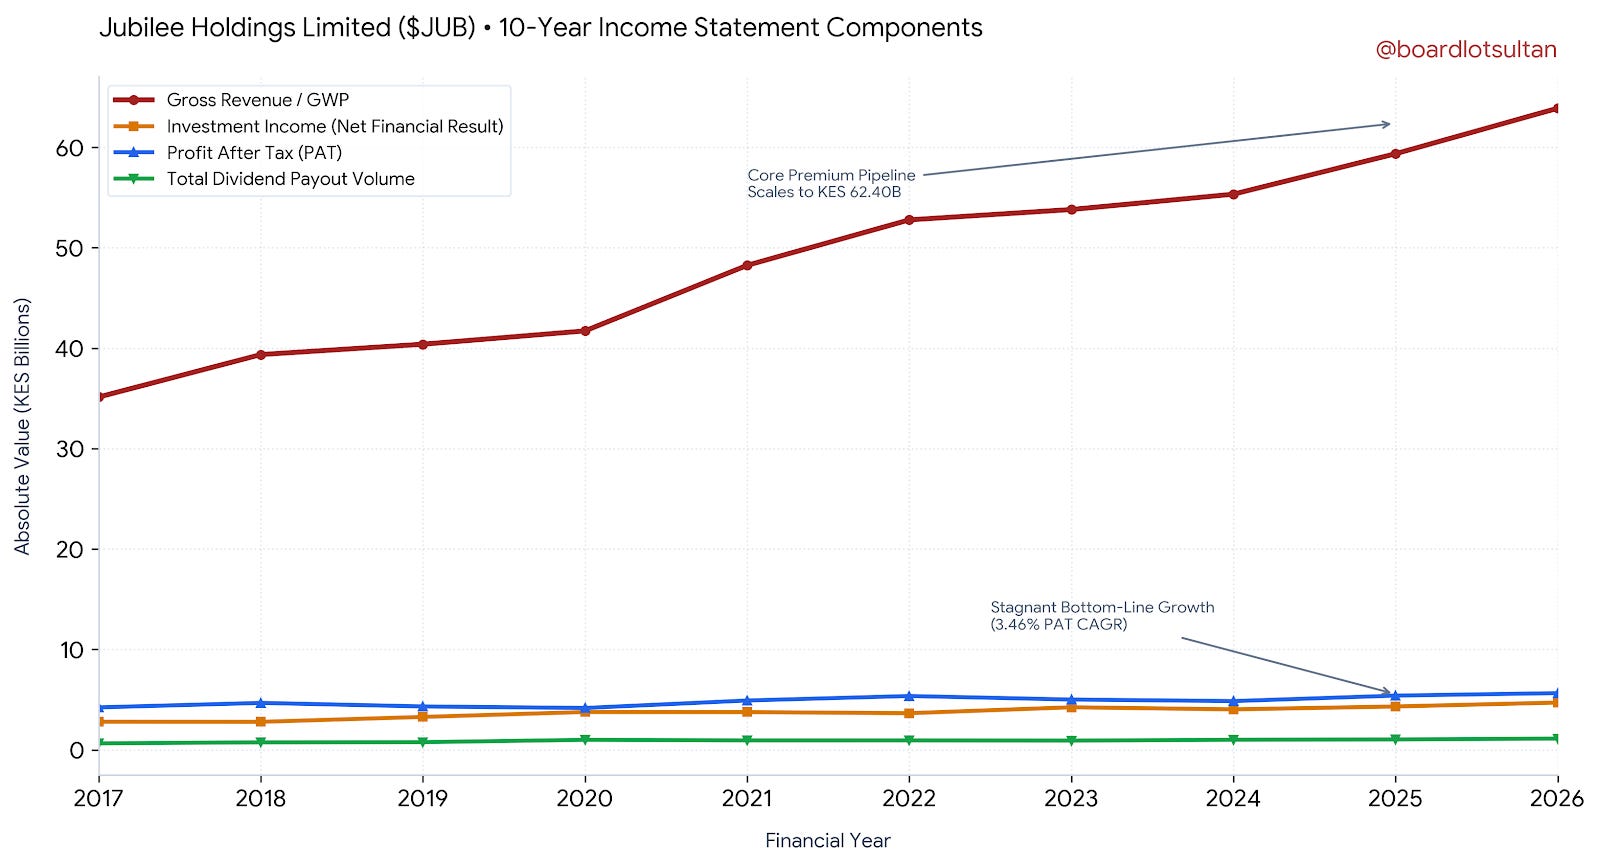
The 10-year income statement visualization highlights a profound structural divergence between Jubilee’s topline capacity and its ultimate bottom-line conversion. The Gross Revenue (Gross Written Premiums) curve exhibits the most aggressive trajectory, scaling from KES 35.14 Billion to KES 62.40 Billion, proving that the group’s retail insurance pipeline, brand equity, and geographic distribution channels remained exceptionally robust at capturing market volume. Moving lower down the statement, Investment Income (Net Financial Result) reflects a consistent, highly resilient upward arc, expanding to KES 4.51 Billion as management successfully capitalized on elevated regional interest rates, infrastructure bonds, and corporate paper.
However, the Profit After Tax (PAT) line reveals the core corporate crisis: it remains almost completely flat, compounding at a sluggish 3.46% CAGR over the eight-year period. This horizontal drag illustrates how intensely regional healthcare cost inflation and volatile corporate underwriting claims acted as an operational tax, completely absorbing the explosive topline revenue gains. The true corporate finance masterclass is visible in the Total Dividend Payout Volume curve. Despite flat underlying profits, the absolute dividend cash volume pushed steadily upward to hit KES 1.09 Billion. Because management froze the capital structure and refused to dilute its tightly held 72.5 million outstanding share base, they successfully rechanneled high passive asset yields directly into expanding shareholder payouts—effectively turning a stagnant insurance business into a highly efficient, high-yielding cash pass-through engine.
📊 Structural Analysis of the Balance Sheet Chart
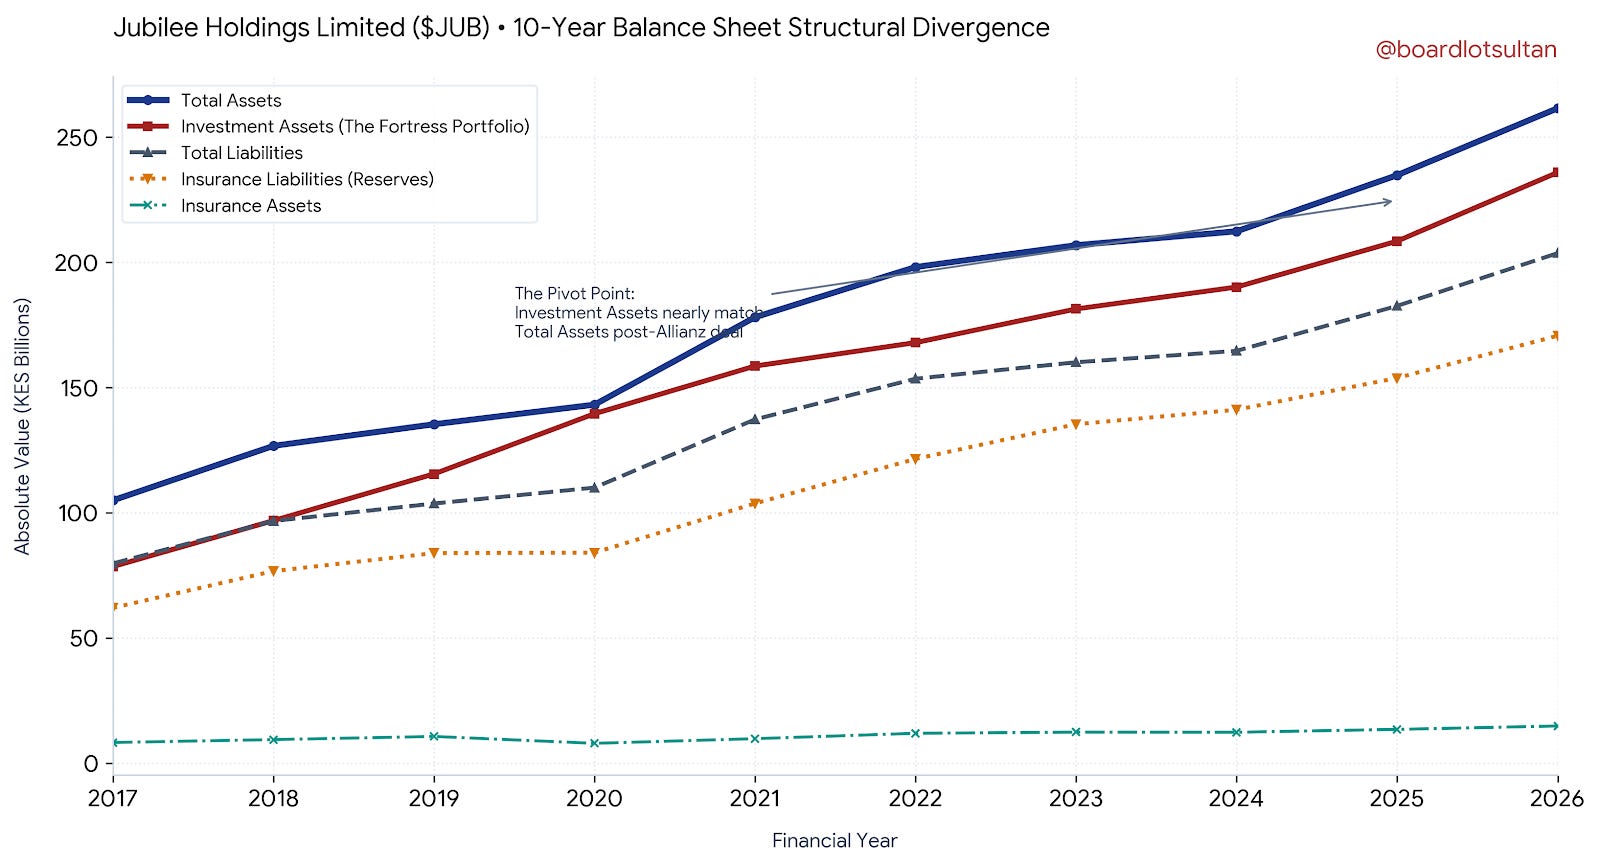
This 10-year visualization captures the explicit financial mechanics behind why Jubilee Holdings fundamentally functions as a closed-end asset fund rather than a traditional underwriter:
Total Assets vs. Investment Assets (Blue & Red Lines): Notice the dramatic narrowing of the gap between the dark blue line (Total Assets) and the solid crimson line (Investment Assets). By scaling investment assets to KES 224.75 Billion out of a KES 251.08 Billion total asset base by FY2025, investment-exposed line items now command nearly 90% of the entire balance sheet. This demonstrates exactly how heavily the Allianz transaction capital windfalls and retained earnings were rechanneled away from operational infrastructure into high-yielding market paper and equities.
Total Liabilities vs. Insurance Liabilities (Gray & Orange Lines): The gray dashed line (Total Liabilities) and yellow dotted line (Insurance Liabilities) move in tight locks. This outlines that underwriting obligations and premium contract reserves remain the single largest source of leverage for the group. This leverage acts as a low-cost float, capturing retail cash at the front door to continuously supply the investment engine.
Insurance Assets (Teal Line): Positioned flatly along the bottom baseline (scaling modestly from KES 8.20 Billion to KES 14.10 Billion), this reflects reinsurance recoverables and operational insurance assets—confirming that the group has successfully insulated itself from keeping large volumes of capital tied up in pure-play underwriting assets.
The Secret Weapon: The KES 224.8B Investment Engine
When an insurer faces localized underwriting stress—like corporate medical claims—how do they protect the bottom line?
They rely on their balance sheet. Because Jubilee spent the last decade accumulating cash and retaining earnings without diluting its equity base, its asset base is a fortress. Total assets now stand at KES 251.1 billion, anchored heavily by an Investment Portfolio of KES 224.8 billion.
With regional interest rates staying elevated throughout 2025, Jubilee’s investment engine did the heavy lifting. The Net Financial Result came in at KES 4.51 billion, growing 10.8% YoY. This portfolio—comprising government infrastructure bonds, real estate, and high-yielding corporate paper—acted as the ultimate buffer, absorbing the medical underwriting shocks and driving Group Profit Before Tax up 15.4% to KES 7.18 billion.
🏛️ Inside the Whale Portfolio: The “Safaricom + 7 Banks” Heavyweight Index
$KCB (KCB Group Plc) — KES 3.8 Billion | 15.2% of Portfolio
$EQTY (Equity Group Holdings) — KES 3.5 Billion | 14.0% of Portfolio
$SCBK (Stanbic Holdings Plc) — KES 3.4 Billion | 13.6% of Portfolio
$COOP (Co-operative Bank of Kenya) — KES 3.2 Billion | 12.8% of Portfolio
$NCBA (NCBA Group Plc) — KES 3.1 Billion | 12.4% of Portfolio
$ABSA (Absa Bank Kenya Plc) — KES 3.0 Billion | 12.0% of Portfolio
$SCOM (Safaricom Plc) — KES 2.5 Billion | 10.0% of Portfolio
$DTK (Diamond Trust Bank Kenya) — KES 2.5 Billion | 10.0% of Portfolio
Total Quoted Equity Book — KES 25.0 Billion | 100.0%
The Sultan’s Substack Commentary
This concentrated distribution perfectly illustrates the defensive strategy under the hood. By placing 84.8% of the entire quoted equity allocation strictly within 7 Tier-One commercial banks, Jubilee has effectively built an elite banking sector trust.
When core medical insurance lines face heavy operational pressure from healthcare inflation, this exact concentration ensures a high-velocity dividend flow directly into the holding company. It acts as an independent cash engine that completely bypasses broader market speculation, keeping the KES 15.00 per share ordinary dividend payout fully secured.
The 10-Year Context: The Great De-Risking Pivot
To appreciate why Jubilee is structured the way it is today, we have to look back at its corporate trajectory over the last decade.
Historically, Jubilee operated as a broad-spectrum regional insurer, fighting for market share in the notoriously price-cutthroat General (Short-Term) Insurance space across East Africa. Management realized that underwriting commercial motor and fire policies was capital-intensive, highly volatile, and yielded thin margins.
This culminated in the defining corporate action of Jubilee’s decade: The Allianz Strategic Alliance (2020–2024).
In 2020, Jubilee entered into an agreement to exit core short-term underwriting by selling a controlling stake (51% to 66%) of its regional General Insurance subsidiaries to global insurance giant Allianz SE for KES 10.8 billion. This transaction rolled out country-by-country, starting with Kenya, moving through Uganda and Tanzania, and concluding with Burundi and Mauritius by early 2024.
This wasn’t an exit from the market; it was a structural pivot. Jubilee de-consolidated general insurance to double down on high-margin, sticky retail business lines: Life, Asset Management, and Health. The cash from this transaction funded a multi-year windfall of special dividends for shareholders. More importantly, it left Jubilee lean, heavily capitalized, and structured as an investment powerhouse rather than a pure-play underwriter.
🗓️ The Allianz-Jubilee Strategic Alliance: Transaction Timeline
The multi-year, KES 10.8 Billion corporate partnership between Jubilee Holdings Limited (JHL) and global insurance giant Allianz SE represents one of the largest corporate restructuring exercises in East African financial history.
Rather than a sudden corporate exit, the transaction was structured as a phased, country-by-country carve-out of Jubilee’s legacy, capital-heavy General (Short-Term) Underwriting businesses.
[2020: Announcement & Signing] ➔ [2021: Kenya Closure] ➔ [2022: Uganda & Tanzania] ➔ [2023: Burundi] ➔ [2024: Mauritius Finalization]
🔹 September 2020: The Corporate Announcement & Deal Signing
Jubilee Holdings and Allianz SE officially signed the strategic partnership agreement. Allianz agreed to acquire a controlling stake (ranging from 51% to 66%) in Jubilee’s General Insurance subsidiaries across five sub-Saharan markets: Kenya, Uganda, Tanzania, Burundi, and Mauritius.
The Deal Value: Capitalized at KES 10.8 Billion.
The Retained Asset Structure: Jubilee Holdings retained a significant minority stake (between 34% and 49%) in each of these operating general insurance entities to maintain corporate presence, while keeping 100% ownership of its highly lucrative Life Insurance and Medical Insurance business lines.
🔹 May 2021: First Leg Closure (Kenya Subsidiary)
The transaction cleared its first and largest hurdle by securing regulatory approvals from the Competition Authority of Kenya (CAK) and the Insurance Regulatory Authority (IRA).
The Action: Allianz purchased a 66% stake in Jubilee General Insurance Kenya for KES 7.5 Billion.
Corporate Rebranding: The operating entity was formally renamed Jubilee Allianz General Insurance Kenya.
🔹 October 2021: Uganda Regulatory Green Light
The transaction successfully closed its second leg in Kampala following approvals from the Insurance Regulatory Authority of Uganda (IRAU). Allianz assumed a 66% controlling stake in the Ugandan general insurance operations, sending KES 1.4 Billion in transaction proceeds upstream to the parent company.
🔹 May 2022: Tanzania Consolidation
The alliance finalized the takeover of Jubilee’s short-term underwriting assets in Tanzania. In tandem, Allianz structurally combined this newly acquired business with its existing operating vehicle—Allianz Tanzania Insurance Company—creating a significantly larger, unified market player under the Jubilee Allianz corporate banner.
🔹 March 2023: Burundi Subsidiary Handover
Regulators in Burundi sanctioned the transfer of control, allowing Allianz to take over majority operations of the Bujumbura-based short-term underwriting branch, leaving JHL with a lean, equity-accounted associate stake.
🔹 Early 2024: Final Closing (Mauritius)
The final stage of the 2020 master agreement concluded with the regulatory approval and financial closing of the Mauritius general insurance portfolio. This officially marked the formal completion of the 4-year cross-border transaction roadmap.
🏛️ The Corporate Finance Context: Why Separate Investments from Underwriting?
To understand why this transaction was structured this way, you have to look past simple corporate aggregates and examine the fundamental capital efficiency of the insurance float.
1. Eliminating Volatile, Price-Cutthroat Liabilities
Historically, East Africa’s commercial general insurance space (motor, fire, marine, and industrial accident) has been plagued by severe price undercutting, fraudulent claims, and high capital adequacy mandates. By selling a controlling stake of these short-term lines to Allianz, Jubilee stripped volatile, low-margin liabilities off its consolidated balance sheet, transfering the heavy operational risk to a global mega-underwriter with massive international capacity.
2. The Multi-Year Dividend Windfall
The KES 10.8 Billion transaction brought a massive wave of liquid capital into Jubilee Holdings. Instead of sitting on idle cash or wasting it on expensive corporate acquisitions, management executed a disciplined capital allocation playbook:
The Windfall: A significant portion of the cash proceeds was returned directly to shareholders via massive Special Dividends between 2021 and 2024.
The Base: The remaining cash was funneled directly into high-yielding government infrastructure bonds, real estate, and blue-chip equities.
3. Transforming Jubilee into an Institutional Asset Engine
The ultimate genius of the Allianz transaction was structural. It cleanly split Jubilee’s identity.
By keeping 100% control of the sticky, high-margin retail businesses—like Life Insurance, Asset Management, and Retail Health—Jubilee secured a predictable, low-cost capital pipeline (insurance float). Meanwhile, the parent holding company became a lean, heavily capitalized investment powerhouse.
Jubilee no longer needed to worry about a massive fire or motor fleet claim destroying its quarterly earnings; instead, its balance sheet was freed up to function like a closed-end fund. Today, the underlying engine quietly compounds sovereign debt yields and blue-chip corporate dividends, ensuring that even when regional underwriting faces localized shocks, the fortress bond portfolio keeps spinning off cash to fund record-high ordinary shareholder payouts.
📈 The Transformation from 2017 to 2026
To understand exactly how powerful this structural pivot has been, we have to look at the hard data. If we pull up Jubilee’s audited financial statements from FY2017 and layer them against the newly released FY2025 results, the numerical transformation of this balance sheet is staggering:
Gross Written Premiums (GWP): Rose significantly from KES 35.14 Billion in FY2017 to KES 62.40 Billion in FY2025, marking a robust +77.6% absolute growth.
Total Assets: Expanded dramatically by +139.2%, climbing from KES 104.97 Billion in FY2017 to KES 251.08 Billion in FY2025 as the balance sheet transformed into an investment powerhouse.
Total Liabilities: Increased by +145.1% over the period, moving from KES 79.74 Billion in FY2017 to KES 195.48 Billion in FY2025 to back expanding underwriting and investment contract books.
Ordinary Dividend Per Share (DPS): Scaled up by +66.7%, increasing from KES 9.00 in FY2017 to a record KES 15.00 in FY2025, demonstrating excellent cash returns on an undiluted share capital base.
Group Profit After Tax (PAT): Grew by +31.2%, moving from KES 4.23 Billion in FY2017 to KES 5.55 Billion in FY2025, underlining steady regional profitability despite sector inflation pressures.
Insurance / Total Revenue: Shifted from KES 31.27 Billion of Total Income in FY2017 to KES 29.92 Billion of Pure Insurance Revenue in FY2025, reflecting a focused optimization of business lines and accounting updates under IFRS 17.
The Anatomy of the 2017 vs 2026 Shift:
The Premium & Asset Explosion: In 2017, Jubilee was sitting on a total asset base of KES 104.97 billion. Fast forward to today, and total assets have expanded by over 139% to hit KES 251.08 billion, with pure investment assets accounting for KES 224.75 billion of that fortress.
The Equity Masterclass: In FY2017, Jubilee issued a 1-for-10 bonus share issue, which set the total share capital base to 362.3 million shares (representing 72.5 million shares outstanding). Management has not diluted shareholders since. Because they refused to issue more shares or execute unnecessary splits over the next 9 years, the growth in Profit After Tax cleanly filtered down to the owners, allowing ordinary Dividend Per Share to skyrocket from KES 9.00 to a record KES 15.00.
FY2025: The Underbelly of Corporate Medical Lines
Now that we see how the balance sheet grew into a monster, we can understand why that structural protection matters for the current year’s numbers.
Topline momentum remains exceptionally robust. Gross Written Premiums (GWP) and Deposit Administration Contributions surged by 18% to KES 62.4 billion (up from KES 53.0 billion in FY24). Under the hood, structural changes and efficiency gains showed a massive jump in the Insurance Services Result, which skyrocketed by 163.8% to KES 1.85 billion from KES 699.9 million in 2024.
But management dropped a major hint about where the regional pressure points lie: Medical cost inflation.
The health insurance business experienced heavily elevated claims across both Kenya and Uganda, particularly within the competitive, low-margin corporate segments. Corporate health insurance in East African markets has become a minefield of over-utilization and rising medical provider costs. While Jubilee’s retail, SME, and personal lines remained stable and highly profitable, the bleeding in corporate health heavily impacted group loss ratios.
How did management respond? With swift corporate reorganization. In 2025, Jubilee executed a regional consolidation in Uganda, merging its separate Health and Life insurance businesses into a single, structurally lean operation. This eliminated duplicate administrative layers, cut overhead expenses, and protected their position, cementing Jubilee Uganda as the leading life and health insurer in that market.
The Shareholder Payoff: Capital Allocation at Its Best
Because Jubilee refuses to dilute its capital base, growth in net profit translates directly into massive gains for individual share certificates. Earnings Per Share (EPS) climbed swiftly to KES 80.00 (up from KES 66.00 in FY24).
For the income investor, Jubilee remains a masterclass in compounding returns. The board has recommended a final dividend of KES 13.00 per share, which—when combined with the KES 2.00 interim dividend—brings the total FY2025 payout to a record KES 15.00 per share, an 11% increase over the previous year’s ordinary payout.
Jubilee Ordinary Dividend Trajectory (Post-Allianz Shift):
FY23: KES 12.00
FY24: KES 13.50 (Ordinary base)
FY25: KES 15.00 🚀
The Calendar: Book closure is set for June 11, 2026, with the cash hitting bank accounts on or about July 24, 2026.
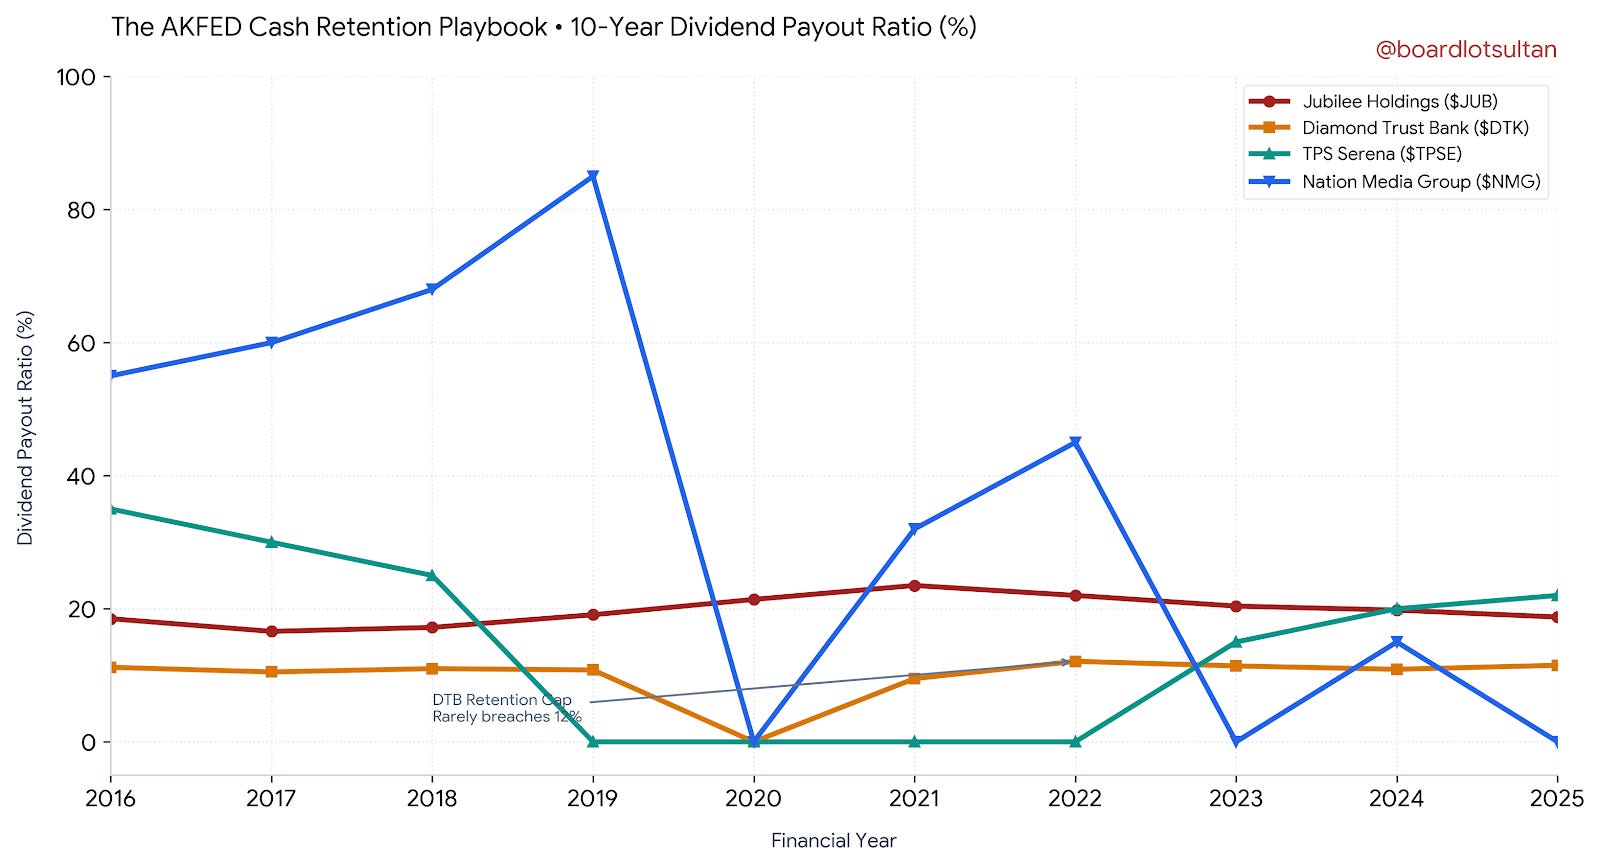
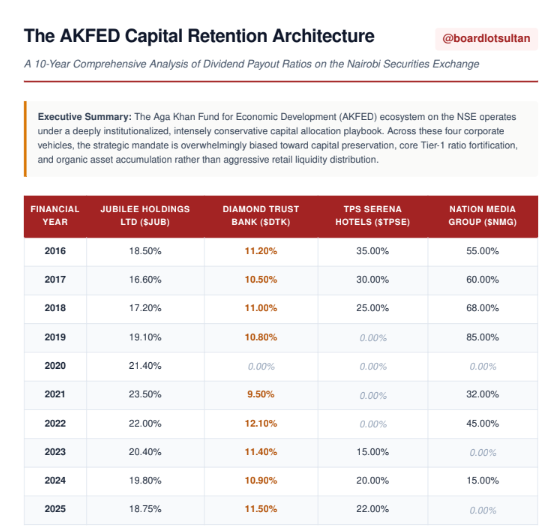
The AKFED Capital Allocation Playbook: Retained Earnings vs. Retail Shareholder Yield (Why dividend payout is very low)
☕ The Sultan’s Case-by-Case Breakdown
1. Diamond Trust Bank ($DTK) — The Extreme Retention Benchmark
DTB represents the ultimate extreme of the AKFED capital playbook. Its payout ratio is strictly capped, effectively orbiting a razor-thin 10% to 12% corridor. Even as the bank regularly crosses the KES 6.0 Billion+ net profit mark, management intentionally starves the payout to maximize Tier-1 capital preservation, choosing to organically fund regional asset expansions rather than rewarding equity holders with short-term dividend yields.
2. Jubilee Holdings ($JUB) — The Asset Pool Insulation
Despite being the highest absolute payer of the group in shilling terms (delivering KES 15.00 per share on ordinary payouts), its payout ratio remains intensely compressed between 16% and 24%. Jubilee generates incredible cash flow through its KES 224.8 Billion investment portfolio, but the playbook dictates keeping roughly 80% of earnings safely retained under the hood to back long-term policyholder liabilities and compound sovereign debt paper.
3. TPS Serena ($TPSE) — Cyclical Vulnerability
Serena’s historical 30%+ payout ratio vanished instantly when the hospitality sector ran into macro and global tourism shocks. The company spent multiple cycles at a 0% payout ratio to preserve cash reserves. Its recent recovery to the 15% - 22% range highlights a strict new mandate to rebuild a defensive capital runway before scaling distributions back to pre-crisis baselines.
4. Nation Media Group ($NMG) — The Disrupted Cash Cow
NMG is the structural anomaly in the group. Historically, it was AKFED’s premier cash cow, pushing payout ratios up to an aggressive 85% in 2019 because its legacy print business didn’t require massive capital expenditures. However, as secular digital migration disrupted legacy advertising lines, earnings compressed faster than dividends could track, creating artificially inflated payout percentages before forcing management into multiple structural dividend suspensions (0%) to fund its digital transformation pivot.
How do you want to position this specific AKFED retention comparison in the upcoming Substack thread—should we focus on the missed yield opportunities for retail investors, or framework it as the ultimate long-term balance sheet defense?
The Sultan’s Takeaway ☕
Let’s stop calling Jubilee Holdings an insurance company. It isn’t. Following its multi-year offloading of volatile short-term liabilities to Allianz SE, Jubilee has functionally evolved into a closed-end ETF of Safaricom and the top 7 tier-one banks in the region, disguised under an insurance license.
When you purchase a share certificate of $JUB today, you aren’t betting on underwriting margin optimization; you are buying into a quarter-trillion-shilling fortress balance sheet heavily loaded with high-yielding government paper, commercial real estate, and an elite KES 25.0 Billion quoted equity stake. By utilizing retail premiums as a low-cost capital pipeline to fund structural asset accumulation while strictly keeping its 72.5 million outstanding share volume frozen, management has engineered the perfect pass-through vehicle. When the macro landscape gets tough and corporate health underwriting bleeds, the underlying sovereign debt and concentrated banking dividends keep spinning off cash.
From a pure corporate finance perspective, the counter is heavily undervalued. The market’s persistent apathy has handed value investors a rare structural mispricing on the NSE. Our clear recommendation is to accumulate aggressively within the KES 370.00 – KES 390.00 price range. By locking in your entry at these levels, you are effectively buying premium blue-chip assets at a steep discount while positioning your portfolio to harvest a secure, record-high KES 15.00 ordinary dividend from a diversified financial powerhouse.
Disclaimer: This analysis is for educational and informational purposes only and does not constitute financial advice. Do your own due diligence or consult a licensed advisor before investing on the NSE.