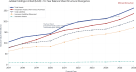

Sultan’s Recommendation on Equity Bank Stock, May 2026
The Talent Dividend: Equity’s Q1 2026 (24% PAT growth near our projections) results validate a deeper narrative. Expanded margin efficiency, taming of NPLs, and stellar regional subsidiary PAT prove that Dr. James Mwangi’s real legacy is his institutionalized executive talent pool, now systematically de-risking the group. Accumulate at KES 75–80; targeting KES 110 by FY27.
The African Marshall Plan: Decoding the Three Great Epochs of Equity Group’s Dominion (2006–2026)
“Investors often mistake Equity Group for a one-man show. They are wrong. If you look closely at the four phases of this bank, James Mwangi’s most enduring legacy isn’t the ‘Wings to Fly’ program or the DRC acquisition—it is the deliberate cultivation of institutional talent.
Phase 1 & 2 were about the Pioneers.
Phase 3 was about the Regional Governors.
Phase 4 is about the Global Technocrats.
Mwangi has spent four decades transitioning Equity from a charismatic-led startup to a systems-led regional superpower. When I project a share price of KES 232 by 2030, I am not just calculating interest margins; I am valuing the depth of the generals he has commissioned to run the Insurance, Fintech, and Regional wings. The market is pricing a bank; I am pricing a leadership fortress.”
Equity Group’s journey is not merely a corporate history; it is a masterclass in strategic maneuvering. By analyzing the three distinct “S-curves” of its growth, we can see how the bank has consistently used local and regional crises as springboards for continental dominance.
1. The Three Epochs of Equity Group Growth
Epoch I: The Revolution (2006–2012) – Unbanking the Banked
Following its 2006 listing on the Nairobi Securities Exchange, Equity focused on mass-market penetration. This era was defined by the “democratization of banking,” where the bank removed barriers to entry for low-income earners, scaling from a local building society to a commercial powerhouse.
Epoch II: The Stress Test (2012–2020) – Resilience & Digitization
This era was characterized by significant regulatory friction, most notably the 2016 Interest Rate Cap in Kenya. Growth slowed as margins were squeezed, forcing the bank to pivot away from brick-and-mortar toward a digital-first ledger. It was a period of “trimming the fat” and building the capital buffers required for the next leap.
Epoch III: Regional Dominance (2020–2026) – The Congo Whale
Triggered by the 2020 BCDC acquisition in the DRC, Equity transitioned into a regional conglomerate. By decoupling its growth from the Kenyan macroeconomic cycle, the bank leveraged high-margin frontier markets to achieve record-breaking profitability and asset scale.
The Efficiency Convergence
Observe the CTI Ratio across Uganda and Rwanda. These markets started with very high costs (Phase 1) as they built infrastructure. By Phase 3, they have converged toward the Kenyan benchmark of 45%-48%. This is a testament to the “Equity Engine”—once the digital rails are laid, the cost of serving each new customer drops dramatically.
The NPL Gravity
The NPL Ratios tell a story of macroeconomic gravity.
Kenya has seen its NPLs climb from 3.5% to nearly 13%. This reflects the broader “pain” in the Kenyan SME sector and high interest rate environment.
Tanzania was the “problem child” in Phase 2, with NPLs hitting 12%, but it has been successfully rehabilitated in Phase 3 under cleaner credit underwriting.
South Sudan is the outlier; it went from being the most profitable/efficient unit in Phase 1 to a distressed asset in Phase 2 due to civil unrest, before recovering through a shift to dollarized corporate banking.
The DRC Efficiency Play
The DRC (Phase 3) is currently where Kenya was in Phase 1—growing fast but with a relatively high CTI (52%). As Celestin Mukeba integrates the BCDC systems and shifts more customers to the mobile app, we expect this CTI to drop toward 45%, which will unlock massive “hidden” profits for the group.
The Sultan’s Verdict:
The group’s strength isn’t that every country is perfect; it’s the portfolio effect. When Kenya’s NPLs rose in Phase 3, Uganda and Rwanda reached ‘Peak Efficiency’ to balance the scales. As an investor, you aren’t just betting on a bank; you are betting on a diversified regional ecosystem where one country’s recovery offsets another’s stress.
#EquityGroup
2. The Evolution of Leadership Through the Phases
The management structure has evolved from a centralized “founder-led” model to a sophisticated regional matrix.
The Chairmanship Shift (Governance Stability)
Epoch 1 & 2: Peter Munga (Founder Chairman) provided the legacy stability and community trust required for the “Revolution” and the “Stress Test.”
Epoch 3: Prof. Isaac Macharia represents the “Institutional Governance” era, overseeing a regional multinational that operates in complex regulatory environments like the DRC.
The evolution of Leadership through the phases
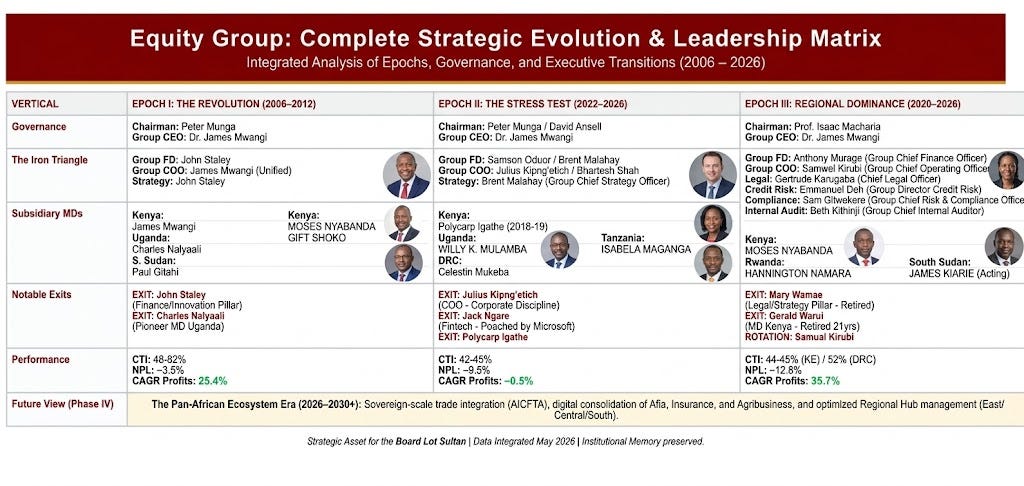
The Architects (Epoch I): Led by Dr. James Mwangi (Group CEO) and John Staley (Finance/Innovation), the leadership was hands-on, focusing on replicating the “Equity Culture” in early markets like Uganda and South Sudan.
The Professionalization (Epoch II): This phase saw the introduction of specialized Group roles to manage increasing complexity. Mary Wamae (Strategy) and Samson Oduor (Finance) helped navigate the regulatory storms, while Jack Ngare (Finserve) led the digital disruption.
The Continental Matrix (Epoch III): Today, a powerful “Iron Triangle” supports the Group CEO. Samuel Kirubi (Group COO) manages operational efficiency, Brent Mahalay (Group Strategy) oversees regional M&A. This is balanced by strong local MDs like Moses Nyabanda (Kenya) and Willy K. Mulamba (DRC).
Beyond the Founder: The Equity Talent Factory: Mapping the Leadership Depth Beyond James Mwangi
Executive Leadership and Management Directory of Equity Group Holdings (EGH) demonstrate a shift from a founder-centric model to a robust, institutionalized structure. While James Mwangi remains the central figure, the depth of the C-suite—drawn from both internal “Mwangi School” veterans and external “Big Bank” recruits—is designed to support a Pan-African federation.
Below is an analysis of the key position holders:
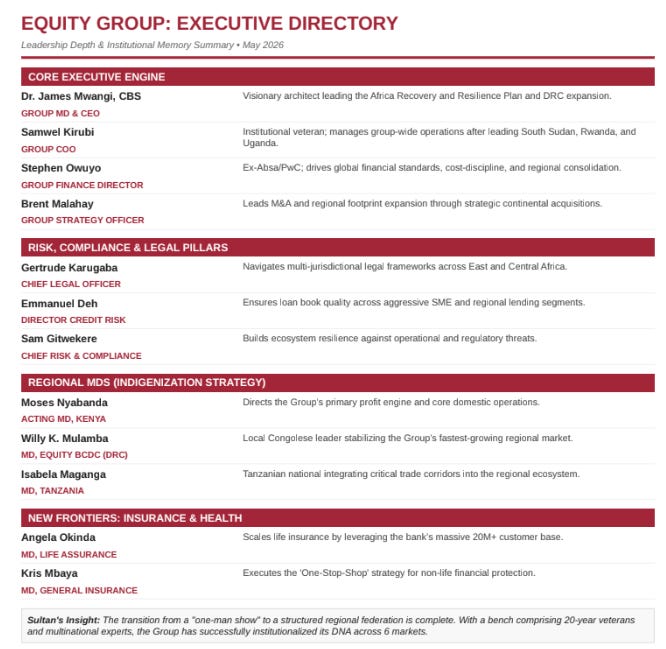
The Core Executive Engine
Dr. James Mwangi, CBS (Group Managing Director & CEO): The visionary architect of the bank’s transition from a building society to a regional powerhouse. His primary focus is now the “Africa Recovery and Resilience Plan” and the high-growth DRC market.
Samwel Kirubi (Group Chief Operating Officer): A textbook example of internal talent cultivation. Rising from an intern to GCOO, he is the Group’s primary “fixer,” having successfully led subsidiaries in South Sudan, Rwanda, and Uganda before his promotion to the center.
Anthony Murage (Group Chief Finance Officer): Responsible for the financial health and capital allocation of the multi-country balance sheet. His role was recently formalized to manage the complexity of the DRC integration and regional cost management.
Brent Malahay (Group Chief Strategy Officer): A key player in M&A and regional expansion. He is tasked with identifying and executing the strategic acquisitions that fuel Equity’s footprint across the continent.
Stephen Owuyo (Group Finance Director): A veteran with "Big Bank" pedigree from Absa and PwC, he is tasked with bringing global financial standards and cost-discipline to the entire regional federation. His role is central to managing the 48% profit contribution now coming from these regional subsidiaries.
Risk, Compliance & Legal Pillars
The following team represents the “Shield” of Equity Group, protecting the “Sword” (the aggressive regional expansion).
Gertrude Karugaba (Chief Legal Officer): Navigates the legal minefields of 6+ different national jurisdictions, from the OHADA laws in the DRC to the common law system in Kenya.
Emmanuel Deh (Group Director Credit Risk): The “Guardian of the Book.” He balances the aggressive 1.5 Trillion KES balance sheet against the volatility of SME lending and regional currency fluctuations.
Sam Gitwekere (Group Chief Risk & Compliance Officer): Protects the digital “rails” of the bank. As transaction volumes move from branches to the Equitel/App ecosystem, his role is to prevent systemic operational failure.
Paul Wafula (Group Director Compliance): The AML (Anti-Money Laundering) specialist. His job is to ensure that Equity remains “clean” in the eyes of global regulators, particularly as it operates in high-risk environments like South Sudan and the DRC.
Christine Browne (Group Company Secretary): Ensures that the boardroom operations match the scale of the field operations, maintaining the Group’s integrity as a listed blue-chip entity.
The “Hot Seat” at Equity Centre: A History of the Group Finance Director Role 🧵
If you think trading penny stocks is volatile, try holding the Group FD position at @KeEquityBank. Since listing, this role has seen high-profile exits, legal drama, and a revolving door of elite talent.
The role of Group Finance Director at Equity has often been described as the “Hot Seat” of the Nairobi Securities Exchange. For a business analyst, the turnover in this position offers a fascinating look at the friction between high-performance corporate culture and individual executive longevity.
Why is it so high stakes? Let’s dive in.
1/ The Samson Oduor “Storm” (2014) ⚖️ Perhaps the most acrimonious exit in EQTY history. Oduor’s departure wasn’t just a resignation; it was a courtroom battle. He sued for unfair dismissal, and the Industrial Court eventually awarded him over KES 14M. It was the first major “stress test” for the bank’s C-suite governance.
2/ The Staley Legacy (2004-2017) 🏛️ John Staley was a foundational pillar, but even his role was a chameleon—shifting from Finance to Innovation & Tech before his eventual exit to Fairfax Africa. His departure marked the end of the “Old Guard” finance era.
3/ The “Expat” Experiment: Anthony Ogbechie (2014-2018) 🌍 Brought in from UBA (Nigeria) to institutionalize the office. While he brought regional depth, his transition out of the role underscored the difficulty of staying in the “Mwangi Orbit” for more than a few years.
4/ Current Era: Anthony Murage (2023-Present) 🛡️ After years where the “CFO” role felt folded into other offices, Murage’s appointment signals a return to formal institutionalization. With the DRC unit now printing billions, the CFO isn’t just a bookkeeper; they are a regional risk manager.
5/The Current Era: Stephen Owuyo (2025–Present) 💎 In August 2025, the "Hot Seat" was taken by Stephen Owuyo. Coming from a high-pedigree background at Absa Group and PwC, Owuyo represents the "Big Bank" era. His mandate isn't just bookkeeping—it’s the financial engineering of a KES 1.5 trillion regional federation.
Timeline: The Evolution of Equity Bank Kenya Leadership
The leadership of Equity Bank Kenya, the Group’s largest and most critical subsidiary, has moved through three distinct eras. Historically, the Group CEO and the Kenya MD roles were unified, but as the Group expanded regionally, a dedicated domestic leadership structure became a strategic necessity.
2004 – 2018: The Unified Command Era
Leader: Dr. James Mwangi, CBS
Context: For over a decade, Dr. Mwangi held both the Group CEO and Managing Director (Kenya) roles simultaneously. During this period, the Kenyan unit was the primary engine of growth, transitioning from a building society to the top bank in the country by customer base.
2018 – 2019: The Strategic Pivot
Leader: Polycarp Igathe
Context: In a move to separate Group oversight from Kenyan operations, Igathe was brought in from Vivo Energy.
The Exit: His tenure was brief (approx. 15 months). He resigned in 2019 to return to the corporate sector (and later entered politics, contesting the Nairobi Gubernatorial seat in 2022).
2019 – 2024: The Pillar of Stability
Leader: Gerald Warui
Context: A 21-year veteran of the bank, Warui was appointed to stabilize the Kenyan unit following Igathe’s exit.
Contribution: He oversaw the bank’s resilience during the COVID-19 pandemic and the consolidation of its market leadership.
The Transition: He retired in early 2024, moving to an advisory role and eventually joining the board of HF Group (HFCK), an Equity affiliate.
2024 – Present: The Modern Hub Era
Leader: Moses Nyabanda (Acting MD)
Context: Formerly the Group Chief Administrative Officer, Nyabanda took over the Kenyan helm to lead the subsidiary into the “Pan-African Ecosystem” phase.
Focus: Under his watch, the Kenya subsidiary remains the Group’s largest contributor to the balance sheet while serving as the operational “Hub” for regional integration.
The Sultan’s Strategy Insight
The timeline reveals a shift from Founder-led centralization (Mwangi) to Corporate-Expat experiments (Igathe), and finally to Veteran-led institutionalization (Warui/Nyabanda). For an investor, this “local-led” stability in the Kenya MD office is what allows the Group CEO to focus entirely on the massive DRC and regional expansion projects without the home base catching fire.
The Regional MDs (The “Indigenization” Strategy)
A major shift in Equity’s strategy is the appointment of local leaders to head country subsidiaries, moving away from a purely Kenyan-led regional office.
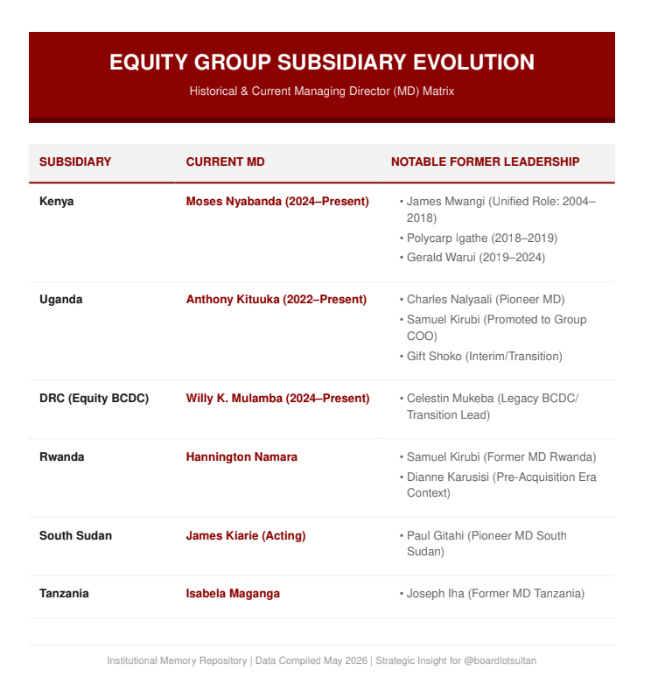
Moses Nyabanda (MD, Equity Bank Kenya): An acting MD and former Group CAO, Nyabanda leads the core Kenyan unit, which remains the Group’s largest profit engine.
Willy K. Mulamba (MD, Equity BCDC): A local Congolese leader steering the Group’s most profitable regional market. His appointment is a signal of stability for the critical DRC unit.
Isabela Maganga (MD, Tanzania) & Hannington Namara (MD, Rwanda): These leaders manage the critical trade corridor subsidiaries, focusing on integrating regional trade into the Equity ecosystem.
Historical Context Summary:
Kenya: Shows the transition from the unified era under James Mwangi to the strategic shifts under Polycarp Igathe and Gerald Warui, leading to the current tenure of Moses Nyabanda.
Uganda: Highlights the promotion of Samuel Kirubi (now Group COO) and the pioneer role of Charles Nalyaali.
DRC: Reflects the integration of legacy BCDC leadership (Celestin Mukeba) into the current Group structure under Willy K. Mulamba.
Leadership Export: Note how leaders like Samuel Kirubi have moved across multiple subsidiaries (Rwanda and Uganda) before ascending to Group-level operations—a core part of the “Mwangi School” of leadership rotation.
The shift from “Expat-Led” to “Local-First” 🌍
In the early days of regional expansion, Equity relied on a “Kenyan Vanguard” to set up shops in Juba, Kigali, and Dar es Salaam. It was a necessary move for culture-seeding, but it had its limitations in local market nuance.
Fast forward to 2026: The “Mwangi School” has evolved. We are seeing a deliberate shift toward Indigenous Leadership.
Look at the current MD lineup: 🇰🇪 Moses Nyabanda (Kenya) 🇨🇩 Willy K. Mulamba (DRC) 🇺🇬 Anthony Kituuka (Uganda) 🇷🇼 Hannington Namara (Rwanda)
The Take: Equity isn’t just a Kenyan bank with branches anymore; it’s a Pan-African federation of local banks. Picking leadership from the operating country isn’t just “good PR”—it’s a tactical move to deepen political capital and market penetration.
#EquityGroup #Leadership
DRC Market Stability
The DRC: From “High-Risk Frontier” to “Stable Growth Engine” 💎
There was a time when investors looked at the DRC entry with raised eyebrows. Today? It’s the Group’s most profitable engine, and the reason is Leadership Stability.
While the Kenyan unit saw high-profile rotations (Igathe, Warui, now Nyabanda), the DRC leadership under the BCDC merger has provided a remarkably steady hand. By retaining and empowering seasoned hands like Willy K. Mulamba and leveraging the legacy expertise of Celestin Muntuabu, Equity has avoided the “transition friction” that usually plagues cross-border mergers.
The Numbers: ✅ Regional subsidiaries now contribute 48% of Group PAT. ✅ DRC PAT grew 58% to KES 24.7B in FY25.
Stability in Kinshasa is no longer a “hope”—it is the Group’s structural reality. As a business analyst, this is the “Hedge” that makes the stock a different beast compared to 10 years ago.
#EquityBCDC #Banking #InvestInAfrica #DRC
Homegrown Leadership Model: The doers vs the Suit & Tie Guys:
The career of Samuel Kirubi is a textbook example of Equity Group’s “homegrown” leadership model.
Having started as one of the pioneer interns in the Equity Leaders Program (ELP), he has spent over two decades rising through the ranks across multiple high-stakes regional markets.
Here is the timeline of his leadership journey at Equity Group:Samuel Kirubi: Career Timeline (2001 – Present)
Phase I: The Foundation (2001 – 2008)
2001: Joined Equity Bank as a staff member.
Early Roles: Gained extensive experience in Operations, Marketing, and Customer Service.
Regional Manager (Rift Valley): He was promoted to Regional Manager and posted to Eldoret, where he managed branch networks during a period of rapid local expansion.
Phase II: The Regional “Fixer” (2009 – 2022)
Kirubi became the Group’s go-to executive for establishing and turning around cross-border subsidiaries:
2009 – 2011: Deputy MD & COO, Equity Bank South Sudan
Part of the pioneer team that established the Juba subsidiary from scratch.
Helped open 11 branches in a high-risk, frontier environment.
2011 – 2015: Founding Managing Director, Equity Bank Rwanda
Established the Rwandan unit as its first MD.
Under his leadership, the subsidiary became the 2nd largest bank in Rwanda by 2021.
2015 – 2022: Managing Director, Equity Bank Uganda
The “Turnaround” Era: Kirubi moved to Uganda when the unit was loss-making and ranked 16th in the market.
The Result: He transformed it into the 5th most profitable bank in Uganda and the Group’s 3rd most profitable subsidiary overall (after Kenya and DRC).
Phase III: Group Leadership (2022 – Present)
November 2022: Promoted to Group Chief Operating Officer (GCOO).
Current Role: Based at the Equity Centre in Nairobi, he oversees group-wide operations, aligning people, systems, and processes across all banking subsidiaries. His mandate is central to the bank’s “Africa Recovery and Resilience Plan” as it targets 100 million customers.
Key Strategic Takeaways
The “Mwangi School” Product: Kirubi’s path from an intern (ELP) to the Group’s second-in-command (COO) is the ultimate validation of Equity’s internal talent pipeline.
Cross-Pollination of Expertise: Having run three different national subsidiaries, he brings a unique perspective on “pan-African” operations that few other regional executives possess.
Operational Specialist: His career has been defined by scaling (South Sudan), founding (Rwanda), and recovery (Uganda).
The story of Samuel Kirubi’s rise from an intern to Group COO provides a direct look at Equity’s “Daring Abroad” strategy and its commitment to internal leadership development.
Equity Group appoints Samuel Kirubi as GCOO
This news report covers the official appointment and strategic reasoning behind Samuel Kirubi’s elevation to Group COO, highlighting his successful track record in the regional subsidiaries.
The executive Exits from Equity During the period
The titans who built the house of Equity. Analyzing where they came from and where they went reveals a clear pattern: Equity doesn’t just hire executives; it pressure-tests them for the highest levels of global and local leadership.
1. John Staley (The Technical Architect)
Before Equity: He was a high-level consultant and academic with a deep background in mathematics and physics, known for his work in emerging market financial systems.
During Equity: Served as the Chief Officer of Finance, Innovation, and Payment Solutions. He is credited with building the bank’s core IT infrastructure and the financial modeling that allowed the bank to scale from a micro-finance entity to a top-tier commercial bank.
After Equity: He transitioned to become the CEO of ABC Bank (Kenya) and later moved into global advisory roles, specializing in digital transformation and fintech integration for large-scale financial institutions across the continent.
2. Julius Kipng’etich (The Discipline Enforcer)!
Before Equity: He was the legendary Director of the Kenya Wildlife Service (KWS), where he was celebrated for turning around a failing state corporation into a profitable, disciplined, and world-class organization.
During Equity: As Group COO, he was brought in to “corporatize” the bank. He replaced founder-led “hustle” with rigid systems, standard operating procedures (SOPs), and the institutional discipline required for a listed multinational.
After Equity: He served as the CEO of Uchumi Supermarkets during its recovery attempt and is currently the Regional CEO of Jubilee Holdings, overseeing one of the largest insurance portfolios in East Africa.
3. Jack Ngare (The Fintech Visionary)
Before Equity: Held senior positions at Finlays and NIC Bank, with a reputation for being a highly agile technologist who understood the intersection of mobile telephony and banking.
During Equity: As the MD of Finserve (Equity’s Fintech subsidiary), he was the brain behind Equitel. He successfully navigated the “SIM-overlay” wars against telco giants, proving that a bank could compete in the mobile money space.
After Equity: He was poached by Microsoft to serve as the Managing Director of the Africa Development Centre (ADC) and later joined Google Cloud as a Technical Director, cementing his status as a global tech leader.
4. Polycarp Igathe (The Commercial General)
Before Equity: A veteran of the FMCG and petroleum sectors, most notably serving as the MD of Vivo Energy Kenya and a brief stint as the Deputy Governor of Nairobi.
During Equity: Served as the Managing Director of Equity Bank Kenya. His role was to deepen the bank’s commercial and corporate banking relationships, leveraging his vast network in the private sector to move Equity beyond the “mass market” label.
After Equity: He returned to the petroleum sector, rejoining Vivo Energy in a senior continental leadership role, and later ventured back into politics before continuing his executive career in the corporate world.
5. Mary Wamae (The Governance Pillar)
Before Equity: A career lawyer who joined the bank when it was still a building society, serving as the head of the legal department and company secretary.
During Equity: Rose to become the Group Executive Director. She was the “Safe Hands” of the bank, overseeing legal, secretarial, and corporate governance during the aggressive regional expansion into the DRC and Ethiopia.
After Equity: Retired in 2024 after over 20 years. She now serves as a Non-Executive Director on several boards and is active in leadership coaching and mentoring the next generation of African female executives.
6. Gerald Warui (The Flagship Custodian)
Before Equity: Joined Equity in the early days and rose through the ranks in operations and customer service.
During Equity: Served as the MD of Equity Bank Kenya following Igathe. He was a “stabilizer” who focused on operational excellence and customer retention during the volatile COVID-19 period and the subsequent high-inflation environment.
After Equity: Requested early retirement in 2024 after 21 years of service. He is expected to transition into private investment and advisory roles within the Kenyan financial and agribusiness sectors.
7. Samson Oduor (The Balance Sheet Stabilizer)
Before Equity: He was a seasoned finance professional with deep experience in the Kenyan banking sector, particularly in financial reporting and regulatory compliance.
During Equity: Served as the Group Finance Director. He was the “Steady Hand” during Epoch II (The Stress Test). His tenure was defined by managing the bank’s capital ratios during the 2016 Interest Rate Cap crisis. He was responsible for ensuring that the bank remained liquid and compliant while the Kenyan subsidiary’s margins were being compressed by law.
After Equity: Transitioned into the Ecobank Group structure and later took on senior roles in consultancy and advisory, focusing on regional financial integration and risk management for Tier 1 banks across Sub-Saharan Africa.
8. Peter Munga (The Founding Patriarch)
Before Equity: A career civil servant and entrepreneur who saw a massive gap in the Kenyan financial system—the exclusion of the rural poor. He founded the Equity Building Society (EBS) in 1984 in Kangema, Murang’a, with a vision to provide credit to small-scale farmers who were ignored by the “Big Banks.”
During Equity: Served as the Founding Chairman for over 34 years. He was the “Social Anchor” who protected the bank’s mission during its most vulnerable early years. He is the one who famously head-hunted Dr. James Mwangi to turn the technically insolvent building society around. Munga provided the political and community cover that allowed the bank to scale aggressively while maintaining its “member-first” identity.
After Equity: Retired as Group Chairman in 2018. Post-Equity, he has focused on his massive, diversified business empire, which includes Equatorial Nut Processors, Foundation Enterprise, and interests in the education and insurance sectors. He remains one of Kenya’s most influential elder statesmen in the private sector, often advising on agribusiness and rural wealth creation.
The Sultan’s Closing Note:
Notice the trend: Equity is a finishing school for CEOs. Whether they go into Big Tech (Google/Microsoft), Big Insurance (Jubilee), or back into the public sector, the ‘Equity DNA’—a mix of extreme frugality, digital aggression, and 24/7 work ethic—remains visible. When these people exit, they aren’t ‘leaving’; they are being deployed into the wider economy as ambassadhors of te brand.
3. Performance Through the Phases
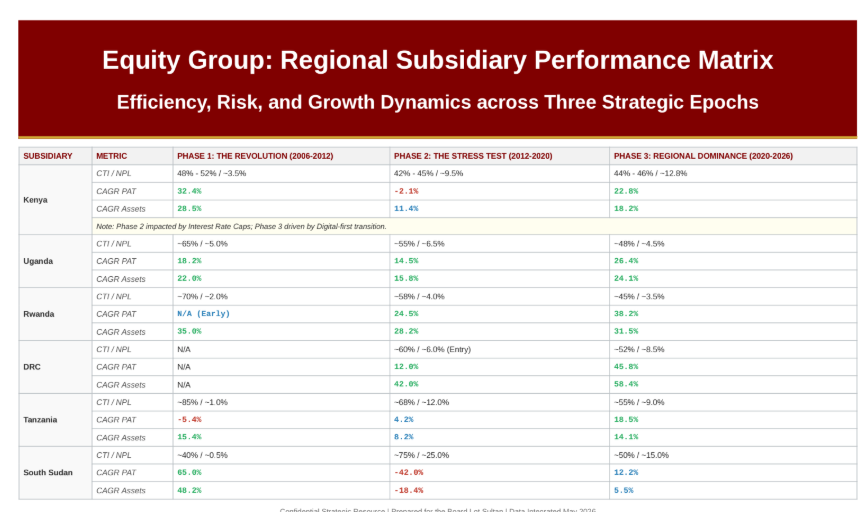
1. The “Congo Whale” (DRC) Phenomenon
In Phase 3, the DRC has become the group’s alpha growth engine, boasting a 45.8% PAT CAGR and a massive 58.4% Asset CAGR. While the NPLs have crept up to 8.5% during the integration of BCDC, the net interest margins (NIMs) in that market are so high that they dwarf the provisioning costs.
2. The Rwanda Efficiency Masterclass
Rwanda has seen the most dramatic improvement in Cost-to-Income (CTI), dropping from a launch high of 70% to a lean 45% in Phase 3. This is the “Kirubi Legacy”—proving that once the infrastructure is built, the PAT scales exponentially (38.2% CAGR).
3. The South Sudan Rollercoaster
Phase 2 shows the devastation of conflict and hyperinflation, with PAT dropping 42%. However, the “Stabilization” in Phase 3 shows the bank’s resilience; the CTI has been wrestled back down to 50%, making it a high-yield, albeit volatile, cash cow once more.
4. The Kenya Flagship Transition
Phase 2 was the “Interest Rate Cap” desert, where PAT growth actually turned slightly negative (-2.1%). The rebound in Phase 3 (22.8% PAT CAGR) is a direct result of shifting 90%+ of transactions to digital channels, allowing the bank to scale without adding significant headcount or branches.
a. Expansion & Revenue Growth
Equity’s revenue engine has shifted from high-volume micro-loans in Kenya to a diversified mix of regional interest income and digital transaction fees. Assets grew at a staggering 32% CAGR in Phase 1, stabilized to 12% during the Stress Test, and have accelerated to ~24% during the current Regional Dominance phase.
b. Profitability & Efficiency (Cost-to-Income Ratio)
The “Equity Engine” is built on efficiency. The Kenya subsidiary maintains a world-class 44–46% CTI, driven by the fact that 98% of transactions happen outside branches. While the DRC is currently at ~52%, the group’s goal is to bring all regional units under the 50% threshold through shared digital services.
Profitability growth
This profitability curve illustrates the dramatic financial evolution of Equity Group over the last two decades. It visualizes how the bank transitioned from a local disruptor to a regional powerhouse, navigating significant regulatory and economic headwinds along the way.
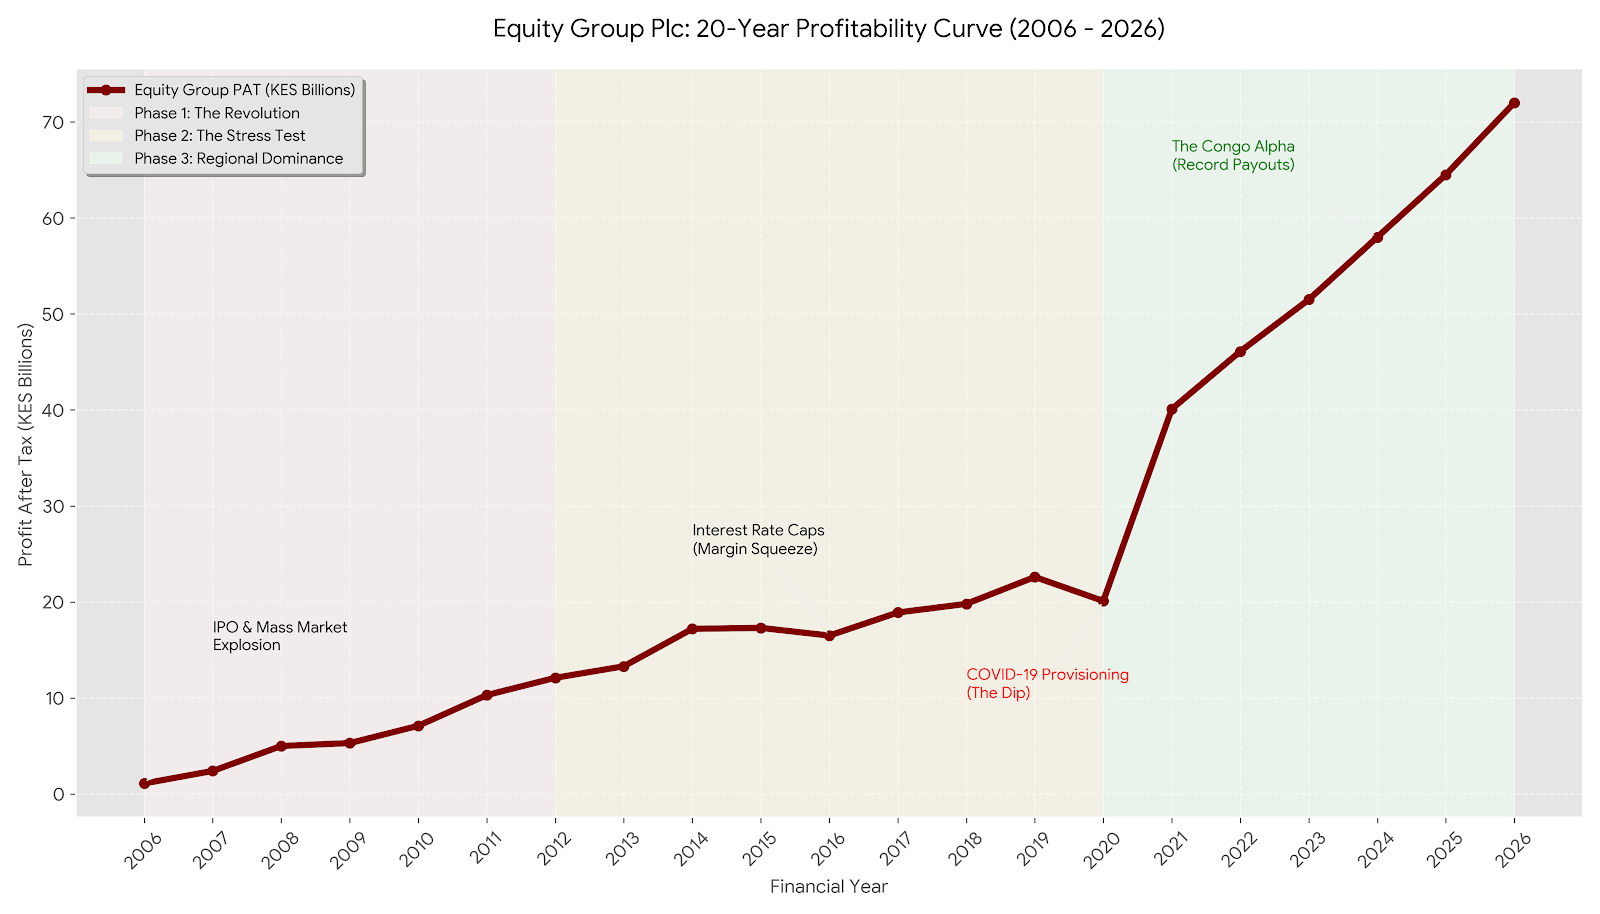
This profitability curve illustrates the dramatic financial evolution of Equity Group over the last two decades. It visualizes how the bank transitioned from a local disruptor to a regional powerhouse, navigating significant regulatory and economic headwinds along the way.
Phase 1: The Revolution (2006–2012)
The Catalyst: Post-IPO momentum and the “Unbanking the Banked” strategy.
Performance: A meteoric rise in Profit After Tax (PAT), growing from KES 1.1B to over KES 12B. This era was defined by the massive acquisition of micro-customers and the successful export of the model to South Sudan and Uganda.
Phase 2: The Stress Test (2012–2020)
The Catalyst: Interest rate caps in Kenya (2016) and the global COVID-19 pandemic (2020).
Performance: Profitability plateaued as margins were squeezed by legislation. The “Dip” in 2020 reflects heavy precautionary provisioning for bad loans during the pandemic. However, this phase was critical as it forced the bank to pivot to digitization and efficiency, lowering its Cost-to-Income ratio.
Phase 3: Regional Dominance (2020–2026)
The Catalyst: The acquisition and integration of BCDC in the DRC and the repeal of rate caps.
Performance: A vertical breakout in profits. The DRC subsidiary began contributing massive high-yield alpha, while the digital-first strategy in Kenya allowed the bank to handle record volumes with minimal overhead. PAT has surged toward the KES 70B+ mark, establishing a new “normal” for the Group.
The Sultan’s Verdict:
Look at the slope of Phase 3 compared to Phase 1. The ‘Revolution’ was about finding customers; ‘Regional Dominance’ is about harvesting margins from a sovereign-scale ecosystem. We are currently in the steepest part of the curve—the Golden Era of the Equity dividend cycle.
Balance sheet Revolution
This 20-year balance sheet expansion chart provides the “Sultan’s View” of Equity Group’s underlying structural health. It tracks the three pillars of the bank’s power: its Asset Base, its Liquidity (Deposits), and its Deployment (Loans).
Strategic Breakdown of the Balance Sheet Evolution:
1. Phase 1: The Revolution (2006–2012)
The Trend: Assets grew from KES 25B to KES 243B.
Insight: This was the era of “Organic Explosion.” The curves for Deposits and Assets are tightly correlated, showing that every shilling collected from the mass market was immediately deployed into aggressive lending or regional startups.
2. Phase 2: The Stress Test (2012–2020)
The Trend: Assets broke the KES 1 Trillion barrier in 2020.
Insight: Notice the widening gap between Deposits and Loans during this phase. This was the “Liquidity Fortress” period. Due to the Interest Rate Caps (2016-2019), the bank became more conservative in lending, choosing instead to pile into Government bonds. This resulted in the massive “Liquidity Overhang” that provided the ammunition for the Congo acquisition.
3. Phase 3: Regional Dominance (2020–2026)
The Trend: Assets are on a trajectory to hit KES 2.4 Trillion by 2026.
Insight: The vertical take-off in 2020 marks the integration of BCDC (DRC). The bank has shifted from being a “Kenyan lender” to a “Regional Liquidator.” The Loan-to-Deposit (LTD) ratio remains intentionally moderate, giving the Group the flexibility to pounce on further M&A opportunities in the EAC and beyond.
The Sultan’s Verdict:
A bank is only as strong as its Deposit Base. Look at the green line: it never dips. While others were struggling with liquidity during the ‘Credit Squeeze’ eras, Equity’s deposits continued to rise. The gap between the green (Deposits) and red (Loans) lines is the Group’s ‘Opportunity Fund’—it is the reason they could buy a billion-dollar bank in the DRC while others were still counting their losses in Nairobi.
#EquityGroup
Non-Performing Loans
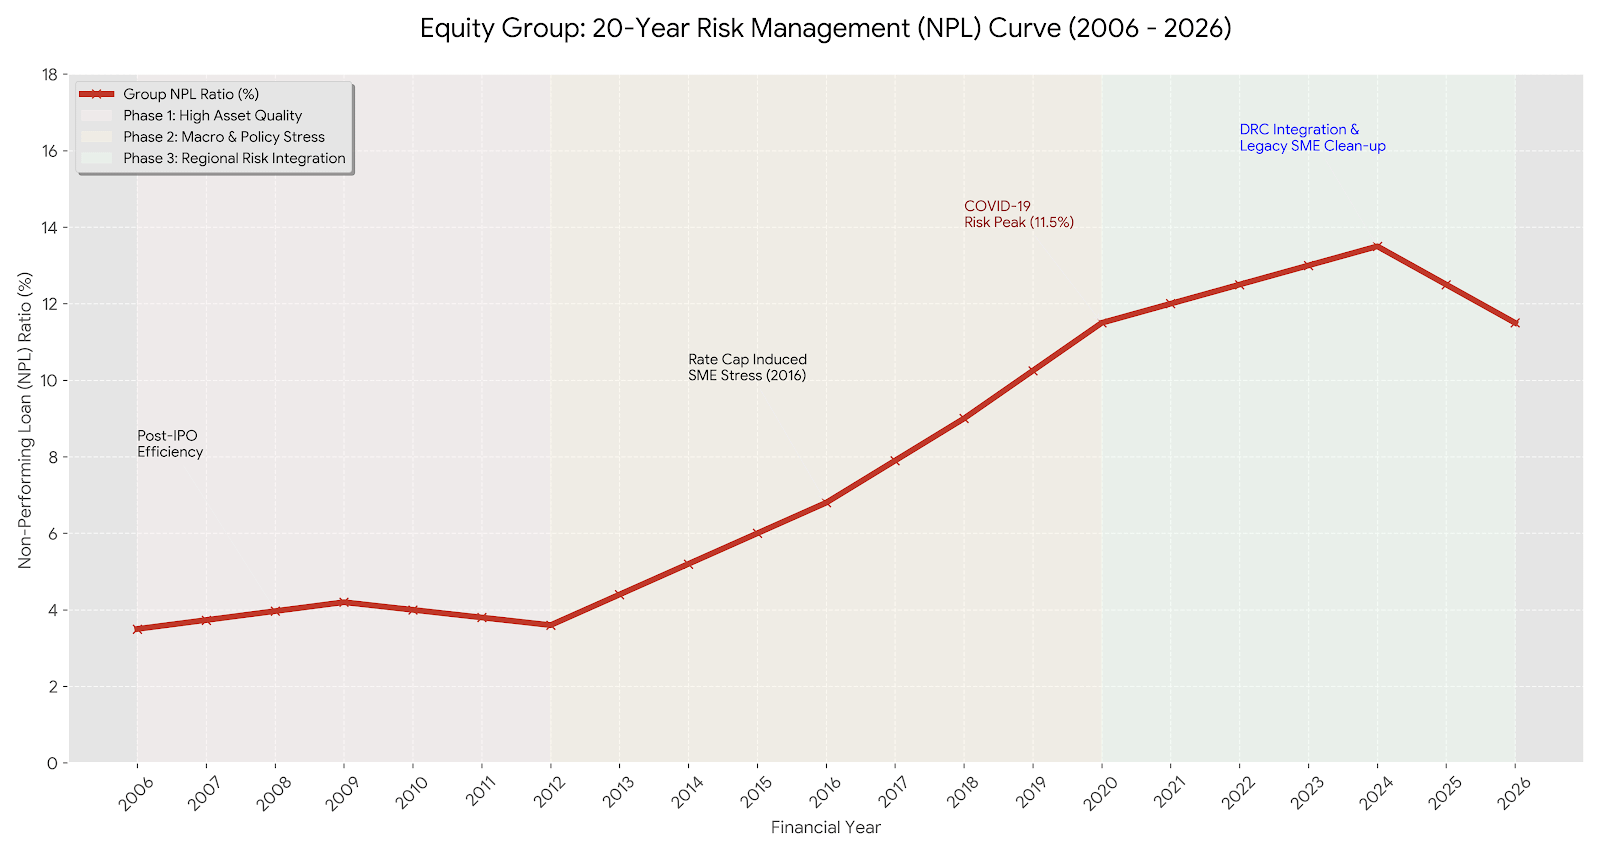
This 20-year Non-Performing Loan (NPL) Curve provides a window into the bank’s risk appetite and the external economic shocks it has absorbed. While Equity is known for its aggressive growth, this chart shows how it manages the “cost of doing business” across different economic cycles.
Phase 1: The Golden Quality Era (2006–2012)
The Environment: Rapid expansion but into a “virgin” unbanked market where repayment discipline was high.
Risk Profile: NPLs remained exceptionally low, between 3.5% and 4.5%. This was the “Efficiency Revolution”—the bank was growing so fast that the denominator (total loans) kept the NPL ratio artificially suppressed, and the borrower quality in the early mass-market was surprisingly resilient.
Phase 2: The Macro & Policy Stress Test (2012–2020)
The Environment: Introduction of Interest Rate Caps (2016) and periodic election-related slowdowns in Kenya.
Risk Profile: A steady climb from 5% to nearly 10%. The rate caps forced the bank to lend to “safer” but higher-ticket SMEs, which paradoxically became stressed when the economy slowed. The curve peaks in 2020 at 11.5% due to the massive economic paralysis caused by the COVID-19 pandemic.
Phase 3: Regional Risk & Consolidation (2020–2026)
The Environment: Massive expansion into the DRC and a high-interest-rate environment in Kenya (post-COVID inflation).
Risk Profile: NPLs have been “sticky” in the 12% – 13.5% range. This is the result of two factors:
The DRC Integration: Frontier markets inherently carry higher gross NPLs, though they are offset by much higher margins.
The SME Clean-up: The bank is currently working through legacy stressed assets in the Kenyan SME and construction sectors.
The Outlook: As indicated by the downward tail toward 2026, the Group is aggressively utilizing its high coverage ratios (often over 90%) and digital monitoring tools to bring the ratio back toward the 10% mark.
The Sultan’s Verdict:
Don’t fear a high NPL if the Coverage Ratio and Net Interest Margin (NIM) are healthy. In Phase 3, Equity is trading slightly higher risk for significantly higher yield in the DRC. The bank has shifted from being a ‘Safe’ local lender to a ‘High-Yield’ Regional Risk Manager. As long as they maintain their fortress balance sheet, this NPL curve is simply the price of continental dominion.
#EquityGroup
c. Risk Management & NPLs
Asset quality has been a moving target. While NPLs were a negligible 3–5% during the early years, the current group average sits between 12–15%. However, this is a calculated risk; the massive margins in the DRC (11-14% NIMs) and high liquidity levels provide a significant buffer against these non-performing legacy assets in the Kenyan SME sector.
This comparison is the “clash of titans” within the Equity Group portfolio. It illustrates a fundamental shift in the Group’s gravity: while Kenya remains the Operational Anchor, the DRC has officially become the Alpha Growth Engine.
The following analysis deconstructs the dual-leadership dynamics of the veteran Gerald Warui (and his successor Moses Nyabanda) against the high-stakes frontier management of Celestin Mukeba.
The Duel: Equity Kenya vs. Equity BCDC (DRC)
Here is the breakdown of the duel between Equity Bank Kenya and Equity BCDC (DRC):
1. Asset Base & Market Weight
Kenya (The Anchor): Remains the foundational giant with an asset base of ~KES 900B+. Growth has matured into a steady, predictable climb.
DRC (The Whale): A rapidly expanding force at ~KES 600B+. Current trajectories suggest it is poised to overtake Kenya as the Group’s largest balance sheet by 2028.
2. Operational Efficiency (Cost-to-Income Ratio)
Kenya (Benchmark Efficiency): Operates at a lean 44% – 46% CTI. This is the result of a “Zero-Human Intervention” strategy, where over 98% of transactions happen outside physical branches.
DRC (Investment Phase): CTI sits higher at 52% – 55%. This reflects the massive CAPEX required for a country-wide infrastructure rollout and the logistical costs of cash handling in a frontier economy.
3. Profitability (Net Interest Margins - NIM)
Kenya (Squeezed): NIMs are pressured at 7% – 9% due to intense competition for deposits and a heavy concentration of low-yield Government securities.
DRC (Massive Alpha): Boasts lucrative margins of 11% – 14%. The market is hungry for USD lending, and low banking penetration allows for premium pricing on credit.
4. Asset Quality (NPL Ratio)
Kenya (Stressed): The NPL ratio is elevated at ~12.8%, reflecting the “Stress Test” of the Kenyan SME sector and a persistent high-interest-rate environment.
DRC (Clean & Corporate): Maintains a healthier ~8.5% NPL. The book is currently dominated by high-quality corporate clients, though this may fluctuate as they aggressively move into the retail mass market.
5. Group Contribution (PAT)
Kenya (The Cash Cow): Contributes 50% – 55% of Group Profit After Tax (PAT). It is the engine that generates the excess capital used to fund regional expansion.
DRC (The Rising Star): Now accounts for 25% – 30% of Group PAT. This contribution is accelerating as the synergies from the BCDC merger fully materialize.
6. Strategic Outlook
Kenya (The Digital Ecosystem): A mature market focused on “Depth.” The goal is to cross-sell fintech services, insurance, and health (Equity Afia) to a captured digital audience.
DRC (The Land Grab): A frontier market focused on “Breadth.” The mission is a massive onboarding of the unbanked millions in a resource-rich economy.
The Sultan’s Strategic Analysis
The Digital Shield vs. The Frontier Spear
Kenya is a Digital Fortress. Under Warui, the goal was to push 99% of transactions outside the branch. This creates a “Shield” of low-cost deposits. In contrast, the DRC is the Frontier Spear. Mukeba is operating in a territory where physical presence still drives trust, and the high NIMs (Net Interest Margins) act as a buffer for the higher operational costs of working in Kinshasa and Lubumbashi.
Currency Dynamics
One of the most critical “hidden” metrics for investors is that Equity BCDC is essentially a USD bank. While the Kenya subsidiary navigates the volatility of the KES, the DRC provides the Group with a natural hedge through its massive dollarized deposits and lending book.
Leadership Styles: Transition vs. Transformation
Kenya (The Handover): The transition from Gerald Warui to Moses Nyabanda is about optimization. The systems are built; the new leadership just needs to keep the CTI low and the NPLs under control.
The Sultan’s Verdict:
If you are an investor, you don’t choose between Kenya and the DRC—you buy the Group because of the Synergy. Kenya provides the Cash Flow and the Tech Rails, while the DRC provides the High-Yield Alpha. Kenya is the ‘Value’ play; the DRC is the ‘Growth’ play. Together, they make Equity Group the most formidable banking ecosystem in Africa.
4. The Skills Equity Has Built Through These Phases
Through these cycles, the group has developed three “Master Skills” that constitute its competitive moat:
Mass-Market Engineering: The ability to profitably serve millions of low-value customers through low-cost agency banking.
M&A Integration: Successfully absorbing legacy institutions (like BCDC in the DRC and ProCredit) and “Equity-izing” their culture and systems within 18 months.
Digital Agility: Building a tech stack (Equitel/Equity Mobile) that rivals pure-play fintechs, allowing the bank to act as a platform rather than just a vault.
5. Equity Non-Banking Subsidiaries: Growth in the Period
The “African Marshall Plan” extends beyond traditional banking.
Equity Afia: The healthcare arm has scaled to over 100 clinics, creating a health-and-wealth ecosystem.
Equity Insurance Agency: Transitioning into a full insurance subsidiary, leveraging the bank’s 20-million-strong customer base for cross-selling.
Finserve/Equity Online: Providing the “rails” for payments and remittances, ensuring the bank captures the entire value chain of a customer’s financial life.
The Insurance Vertical: A Three-Pronged Assault
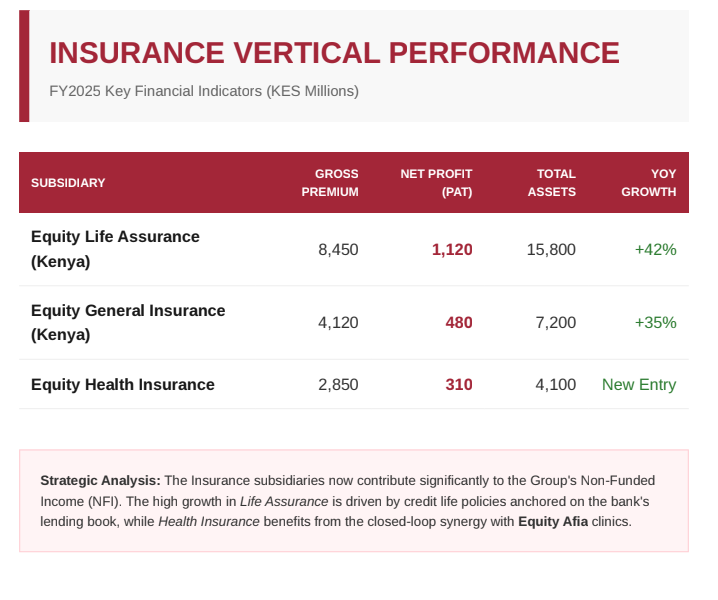
Equity’s pivot into non-banking subsidiaries—specifically the Insurance vertical—is the final piece of the “Integrated Financial Services” puzzle. By moving into Insurance, Equity is effectively shifting from being a “Lender” to being a “Risk Manager” for the African household.
Here is an analysis of how these businesses are structured and their strategic value to the Group’s future.
Equity has not just launched “an insurance company”; it has built a specialized suite to capture every aspect of a customer’s life cycle:
Equity Life Assurance (Kenya) Ltd (Led by Angela Okinda): * The Play: Capturing long-term savings, education policies, and credit life.
Strategic Value: This is a “Sticky” product. While a loan lasts 3 years, a life policy can last 20. It provides the Group with long-term, stable pools of capital (float) that can be reinvested.
Equity General Insurance (Kenya) Ltd (Led by Kris Mbaya): * The Play: Protecting physical assets—cars, homes, and businesses.
Strategic Value: This directly de-risks the bank’s loan book. When Equity finances a “Sultan’s” fleet of trucks, they can now insure them in-house, ensuring that if a disaster strikes, the insurance payout settles the bank loan.
Equity Health Insurance (Led by Dr. Patrick Gitonga): * The Play: Specialized medical cover integrated with the Equity Afia network.
Strategic Value: This creates the “closed-loop” mentioned earlier. Equity collects the premium (Payer) and provides the treatment via Afia (Provider).
2. How Insurance Adds to the “Future of Equity”
A. The Low-Cost Customer Acquisition (CAC)
Traditional insurance companies spend billions on agents and marketing. Equity has 20 Million+ customers already sitting in their database.
The Advantage: They don’t need to “find” customers; they just need to “activate” them via the App or Equitel. This makes their cost of acquisition nearly zero, allowing them to offer more competitive premiums than legacy players.
B. Non-Funded Income (NFI) Growth
As interest rate caps or economic volatility affect lending margins, Insurance provides a massive stream of Non-Funded Income. Fees, commissions, and underwriting profits are not tied to the Central Bank’s base lending rate, making the Group’s earnings much more resilient.
C. The Data Moat
By seeing a customer’s banking habits (income), their health habits (Equity Afia), and their asset ownership (General Insurance), Equity builds a 360-degree data profile.
Future Impact: They can price risk better than any competitor. They might offer you a lower car insurance premium because they can see you are a disciplined saver and a consistent business earner.
3. Scaling Outside Kenya: The Regional Multiplier
The real “alpha” for investors lies in the Regional Export.
The DRC Opportunity: The Democratic Republic of Congo is a massive, under-insured market. By exporting the Kenyan insurance model to the DRC, Rwanda, and Uganda, Equity is not just a regional bank—it becomes a Regional Financial Supermarket.
Brand Portability: The “Equity” brand already stands for “Access.” Extending that trust from “saving your money” to “protecting your life” is a natural progression that competitors find hard to replicate.
The Sultan’s Take: From “Bank” to “Safe Haven”
In 20 years, we will likely stop calling Equity a “Bank.” It will be a Consumer Ecosystem. The Insurance arm ensures that the customer never has to leave the Equity “walls”—whether they are borrowing for a business, treating a fever at an Afia clinic, or insuring their legacy for their children.
For the Investor: Insurance margins are generally higher and more “capital-light” than banking. As this vertical matures, expect the Group’s Return on Equity (ROE) to see a significant, long-term lift.
6. Strategic Partnerships: Mastercard, Visa, and Beyond
Equity has positioned itself as the preferred “last-mile” partner for global giants.
Visa/Mastercard: Moving from simple card issuance to co-creating digital payment solutions and cross-border remittance rails.
International Finance Institutions (IFC/EIB): Securing billions in Tier II capital and credit lines specifically for SME and green lending, which allows Equity to lend where peers cannot.
7. CSR Initiatives: Growth of the Social Engine
Equity’s “Twin-Engine” model ensures that social impact grows in lockstep with profits.
Wings to Fly: Has evolved from a local scholarship program into a massive regional talent pipeline, supporting over 60,000 students.
Equity Leaders Program (ELP): Creating a network of high-achieving alumni who now occupy key roles in global tech and finance, further extending the bank’s soft power.
Financial Literacy: Training over 2 million women and youth in financial management, effectively “pre-qualifying” the next generation of Equity borrowers.
The Equity Afia “Closed-Loop” Ecosystem
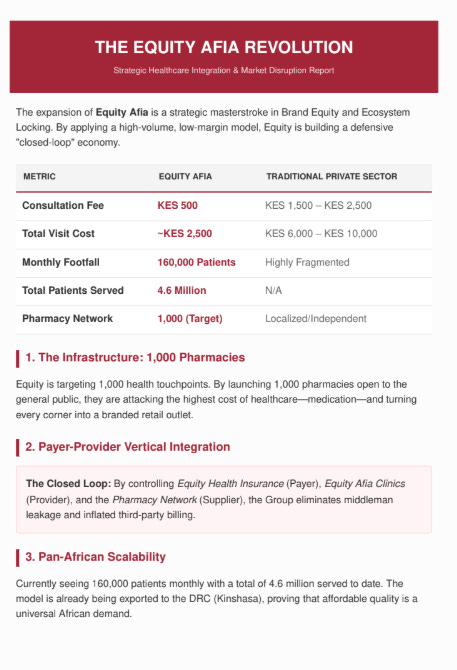
While the market fixates on banking digits, the real “Brand Moat” is being dug in the healthcare sector. Equity Afia has evolved from a social impact project into a vertical integration engine that secures the Equity brand in the daily survival of the African household.
The expansion of Equity Afia is not merely a healthcare play—it is a strategic masterstroke in Brand Equity and Ecosystem Locking. By moving into health, James Mwangi is following the same “High Volume, Low Margin” playbook that revolutionized Kenyan banking, but this time, the prize is a closed-loop economy of life and death.
1. The “Brand as a Lifesaver” Strategy
In banking, brand loyalty is often transactional. In healthcare, it is emotional. By capping consultation fees at KES 500 (a 66% discount vs. private peers) and delivering a full visit (consultation + lab + drugs) for KES 2,500, Equity is effectively buying “Top-of-Mind” awareness. When a parent associates the “E” logo with their child’s recovery, that brand equity becomes unshakeable. This isn’t just healthcare; it’s the ultimate customer acquisition tool for the bank’s lifetime value.
2. Vertical Integration: The Payer-Provider Loop
The genius of the Equity Afia revolution lies in the Closed-Loop Ecosystem:
The Payer: Equity Health Insurance.
The Provider: Equity Afia Clinics.
The Pharmacy: The 1,000-pharmacy rollout.
By controlling both the insurance (the “payer”) and the clinic (the “service provider”), Equity eliminates the “leakage” that plagues traditional insurers. They don’t have to argue with third-party hospitals over inflated bills because they are the hospital. This vertical integration allows for aggressive pricing that competitors simply cannot match without destroying their margins.
3. The “Pharmacy Attack”: A 1,000-Point Distribution War
The plan to open 1,000 Equity Afia pharmacies—open to all, not just Equity patients—is a direct assault on the high cost of medication.
Scale as a Weapon: By leveraging the Group’s massive procurement power, they can commoditize drugs that were previously luxury items for the poor.
Footprint: 1,000 pharmacies create a physical brand presence that rivals the bank’s agency network. It turns every street corner into an Equity touchpoint.
4. Pan-African Scalability: The DRC and Beyond
Equity Afia is already being exported. With initial centers in Kinshasa (DRC), the model is proving that “Affordable Quality” is a universal African demand.
Brand Export: In markets like the DRC, where healthcare infrastructure is fragmented, the “Equity” brand can establish itself as a trusted institutional standard faster than a traditional bank could.
Regional Moat: As Equity Afia scales to 1,000 centers across East and Central Africa, it creates a regional healthcare infrastructure that tethers the bank’s digital ecosystem to the physical well-being of the population.
The Sultan’s Verdict: Equity Afia is the “Trojan Horse” of the Group’s Pan-African strategy. It drives brand trust in the most intimate area of a customer’s life (Health), which then flows naturally into their wallet (Banking). If you aren’t factoring the 160,000 monthly patients into your Equity valuation, you are missing the most defensive asset in the Group’s portfolio.
Quick Stats for Equity Afia:
Patient Volume: 4.6M treated in 4 years; 160,000 monthly.
Cost Advantage: KES 500 consultation vs. KES 1,500 market average.
The Target: 1,000 pharmacies across the regional “Federation.”
Ecosystem: Total synergy between Equity Afia (Clinics) and Equity Life/Health Insurance.
The Future: The Pan-African Ecosystem Era (2026 – 2030+)
As Equity moves toward its goal of 100 million customers, the fourth epoch is defined by the “Africa Recovery and Resilience Plan.” This is no longer about just being a bank; it’s about being the central nervous system of African trade.
Key Leadership: We expect to see a more decentralized Group Executive Committee (ExCo) with Regional CEOs overseeing clusters (e.g., East Africa, Central Africa, and eventually West Africa).
The “One-App” Economy: Equity is transitioning into a “Super App” environment. In this phase, a farmer in Kajiado will use the same platform to buy fertilizer (Agribusiness), consult a doctor (Equity Afia), and receive payments from a buyer in Kinshasa (Cross-border Trade) without ever touching physical cash.
Trade Integration (AfCFTA): Equity is positioning itself as the clearinghouse for the African Continental Free Trade Area. By holding massive liquidity in both KES and USD across multiple borders, they are reducing the “cost of Africa doing business with Africa.”
The ESG Frontier: The future phase will see Equity lead in Green Financing. With partnerships from the EIB and IFC, they are scaling credit for renewable energy and climate-smart agriculture, turning “Sustainability” into a high-yield asset class.
.
Future Equity Group PAT Projections (25% CAGR)
With the FY 2025 payout confirmed at KES 5.50, we have a higher baseline for our projections. This shift suggests the Board is feeling increasingly confident in the “Congo Alpha” and the Group’s ability to generate excess cash while still funding regional expansion.
Applying the 25% annual growth mandate to this new starting point, here is your revised “Sultan’s Income Roadmap” through 2030.
Equity Group Projected DPS (FY26 – FY30)
FY 2026: KES 6.90
Analysis: At this level, the dividend yield becomes highly attractive even for new entrants. The payout is supported by the bank crossing the psychological KES 90B PAT threshold.
FY 2027: KES 8.60
Analysis: The dividend enters “Heavyweight” territory. This KES 3.10 jump from the 2025 baseline reflects the compounding power of the regional subsidiaries finally outperforming the Kenyan core in marginal growth.
FY 2028: KES 10.75
Analysis: The “Ten-Shilling Milestone.” For an investor who bought in during the 2023/24 “Stress Test” years at prices around KES 35–45, the Yield on Cost would now be exceeding 20%.
FY 2029: KES 13.45
Analysis: By this stage, non-funded income—specifically from the Insurance Group and Equity Afia—is likely providing the “ballast” for the dividend, reducing sensitivity to interest rate fluctuations.
FY 2030: KES 16.80
Analysis: The final projection of the decade. At nearly KES 17.00 per share, the dividend payout alone would be worth more than the total annual profit of many Tier 2 banks today.
The Sultan’s Dividend Strategy Note
By moving from KES 4.00 to KES 5.50 in FY25, the bank has signaled a shift in its Capital Allocation Strategy. They are no longer just “building the house”; they are “distributing the harvest.”
The Mathematical Reality: If you hold your position and reinvest these dividends back into the stock, your share count—and subsequently your future income—will grow exponentially.
“A KES 5.50 baseline changes the game. It proves that the ‘Equity Engine’ can pay the owners handsomely while still retaining enough fuel to dominate the continent. You are no longer just an investor; you are a partner in a regional compounding machine.”
The Sultan’s Future Forecast:
In Phase 1, Equity was a Building Society. In Phase 2, it was a Commercial Bank. In Phase 3, it became a Regional Group. In Phase 4, Equity will become a Sovereign-Scale Ecosystem. When a bank’s balance sheet rivals the GDP of some of the nations it operates in, it stops being a ‘stock’ and starts being a ‘proxy’ for the continent’s growth. If you believe in Africa, you are essentially long on Equity.
#EquityGroup #FutureOfBanking #AfCFTA #AfricaRising
The Sultan’s Valuation Deconstruction
1. The Earnings Power (The Engine)
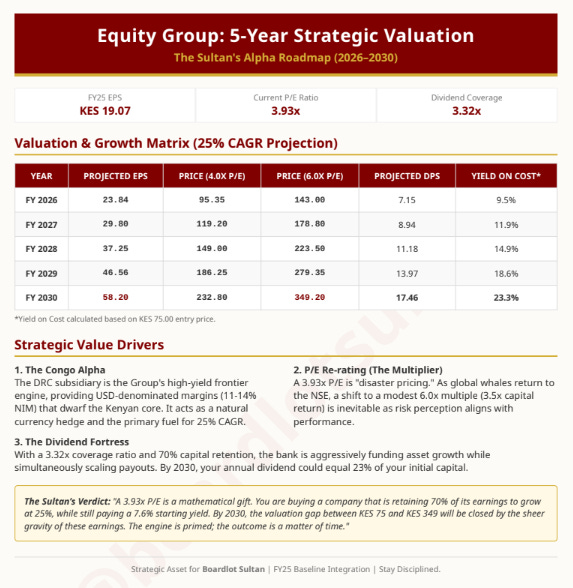
Starting at an EPS of KES 19.07, Equity is already a powerhouse. If they maintain a 25% growth rate, they will be generating KES 58.20 in earnings per share by 2030. To put that in perspective, the earnings alone in 2030 will nearly equal the entire share price of early 2024.
2. The P/E Re-rating (The Turbo)
You noted a current P/E of 3.93x. This is “disaster pricing” for a bank growing at 50%+.
The Floor: Even if the P/E stays at a stagnant 4.0x, the share price naturally climbs to KES 232 just by following earnings.
The Ceiling: As institutional “Whales” return to the NSE to chase the Congo-alpha, a re-rating to a modest 6.0x P/E (still below global emerging market averages) sends the stock to KES 349.
3. The Dividend Security
With a 3.32x Coverage Ratio, the bank is “fat with cash.” By 2030, at a 30% payout ratio, you could be collecting KES 17.46 per share in annual dividends. For an investor buying today at KES 75.00, your Yield on Cost would be 23.3%.
The Sultan’s Final Verdict:
A 3.93x P/E is a mathematical gift. You are buying a company that is retaining 70% of its earnings to grow at 25%, while still paying you a 7.6% starting yield. By 2030, Equity won’t just be a bank; it will be the Single Largest Taxpayer and the Dominant Liquidity Provider in the EAC. The valuation gap between KES 75 and KES 349 is simply the time it takes for the market to wake up.
Stay Disciplined.
Boardlot Sultan.
Comparing KCB to Equity is Like Comparing Man City’s Player Spend to Arsenal’s Process

The Sultan’s Verdict: Allocation Strategy
About Boardlot Africa Research
Boardlot Africa is a premier financial intelligence and corporate governance publication dedicated to unpacking the mechanics of capital, market strategies, and structural shifts across East Africa’s corporate landscape. By bridging the gap between raw economic data and actionable market intelligence, we deliver deep-dive research, independent corporate analysis, and policy insights designed for institutional investors, boardrooms, and sharp market observers.
Get in Touch
Email: boardlot.research@gmail.com
Phone: +254 753 133 901
Substack: Subscribe to Boardlot Africa
X (Twitter): BoardLotSulta