
Kenya’s Pension Sector: Explosive Growth, NSSF Reforms, and Investment Strategy (2025 Deep Dive)
1. Executive Summary
Kenya’s retirement benefits industry has emerged as one of the strongest performing financial sectors in East Africa. As of December 2025, total Assets Under Management (AUM) reached KSh 2.81 trillion, marking a stellar 24.57% year-on-year increase of approximately KSh 554 billion.
This aggressive growth is primarily fueled by the phased implementation of the NSSF Act 2013, robust investment returns, and significantly improved compliance in contributions. The pension sector now represents roughly 16.1% of Kenya’s GDP, serving as a critical engine of long-term domestic capital for government borrowing, infrastructure, equities, and real estate.
The National Social Security Fund (NSSF) remains the dominant anchor of this growth, posting record-breaking performance with a historic 17% interest rate credited to member accounts for FY2024/25. While structural coverage gaps and sovereign concentration risks persist, the current trajectory firmly positions Kenya’s pension industry as a cornerstone of national economic resilience and long-term retirement security
A comparative breakdown of the private fund managers handed the mandate to manage NSSF funds indicates distinct strategies across the two periods:
1. Active Mandates Retained in both 2024 and 2025
Three private asset managers consistently retained their mandates, benefiting from massive asset inflows heavily accelerated by the ongoing implementation of the NSSF Act, 2013:
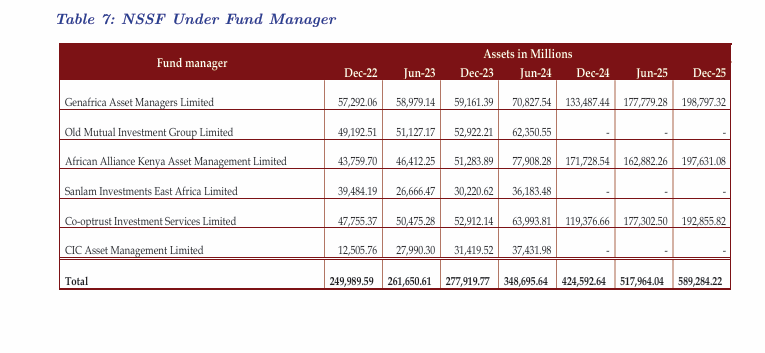
Genafrica Asset Managers Limited: Maintained a continuous upward trajectory. Their NSSF portfolio grew from Ksh 70.83 billion (June 2024) to Ksh 133.49 billion (December 2024), and steadily advanced throughout 2025 to close at Ksh 198.80 billion.
African Alliance Kenya Asset Management Limited: Witnessed a sharp surge in their allocation over the comparison window, leaping from Ksh 77.91 billion (June 2024) to Ksh 171.73 billion (December 2024), finishing the 2025 year at Ksh 197.63 billion.
Co-optrust Investment Services Limited: Saw substantial scaling in their external mandate. Their NSSF portfolio stood at Ksh 63.99 billion in June 2024, grew to Ksh 119.38 billion by December 2024, and surged up to Ksh 192.86 billion by December 2025.
2. Mandates Terminated or Consolidated by 2025
The defining structural shift between the two fiscal timelines was NSSF’s decision to exit three fund managers entirely after mid-2024, reallocating those assets among the surviving three managers listed above:
Old Mutual Investment Group Limited: Managed Ksh 62.35 billion for NSSF as of June 2024, but held Ksh 0 (no active mandate) throughout 2025.
Sanlam Investments East Africa Limited: Held an NSSF portfolio of Ksh 36.18 billion in June 2024, which was fully wound down to Ksh 0 in 2025.
CIC Asset Management Limited: Held an allocation of Ksh 37.43 billion in June 2024, which was also exited completely to Ksh 0 by the 2025 reporting intervals
2. Historical Evolution and Regulatory Framework
Kenya’s modern pension ecosystem has undergone a massive paradigm shift, evolving from fragmented, post-independence provident funds into a highly structured financial framework.
The Regulatory Anchor: Established under the Retirement Benefits Act of 1997, the Retirement Benefits Authority (RBA) provides rigid regulatory oversight. Its mandate has successfully injected professionalism, strict transparency, and aggressive member-protection compliance into the management of retirement schemes.
The Legislative Catalyst: The landmark NSSF Act 2013 fundamentally altered the sector by shifting mandatory social security away from low, flat-rate monthly contributions (previously capped at KSh 200–400) toward an earnings-related, tiered contribution structure (Tier I and Tier II). Following years of legal and hurdles, the phased implementation finally began in earnest in 2023—gradually scaling contribution limits to improve retirement benefit adequacy and aggressively mobilize domestic savings.
3. The Multi-Trillion-Shilling Trajectory
The expansion of Kenya’s retirement savings over the last decade highlights a rapidly maturing financial market.
Industry Growth Metrics (At a Glance)
MetricHistorical Baseline (2016)Mid-2025 PerformanceYear-End Performance (Dec 2025)Total Industry AUM~KSh 0.90 TrillionKSh 2.53 TrillionKSh 2.81 TrillionPension-to-GDP Ratio~9.5%15.2%16.1%Active Membership~2.2 Million~3.8 Million> 4.0 MillionAnnual Contributions~KSh 95 Billion—~KSh 285 Billion
Key Takeaway: Total AUM has more than tripled in under a decade, moving at a Compound Annual Growth Rate (CAGR) of roughly 11–12%. The final six months of 2025 alone saw an influx of KSh 157 billion in new contributions alongside KSh 123 billion in investment income and valuation gains.
While the 16.1% Pension-to-GDP ratio easily outperforms most Sub-Saharan peers, it still underscores a massive room for growth when compared to mature pension markets like South Africa (which sits at over 80%). Currently, coverage sits at roughly 26–27% of the formal workforce.
4. The NSSF Transformation: Phased Contribution Increases
The core engine behind the industry’s recent liquidity surge is the five-phase schedule introduced by the NSSF Act 2013. Both employers and employees contribute 6% each, split into Tier I (pensionable earnings up to the Lower Earnings Limit) and Tier II (earnings between the Lower and Upper Limits).
The 5-Phase Contribution Escalation Schedule
Phase 1 (2023): Lower Earnings Limit (LEL) at KSh 6,000 | Upper Earnings Limit (UEL) at KSh 18,000
Phase 2 (2024): LEL at KSh 7,000 | UEL at KSh 36,000
Phase 3 (Feb 2025): LEL at KSh 8,000 | UEL at KSh 72,000 (Maximum combined monthly contribution: KSh 8,640)
Phase 4 (Feb 2026): LEL at KSh 9,000 | UEL at KSh 108,000
Phase 5 (Future Target): Full implementation matching the structural macroeconomic limits set by the Act.
This gradual, predictable scaling was intentionally designed to give businesses and employees breathing room to adjust to the changing cost of labor and deductions.
5. Macro and Micro Impacts of NSSF Phase Three
The activation of Phase Three in February 2025 acted as a major catalyst for the industry by doubling the Upper Earnings Limit. This heavily impacted higher-earning formal workers and their respective employers.
The Positive Inflows
The higher limits triggered a wave of liquid capital flowing directly into retirement funds. NSSF’s net assets jumped 17.2% in the first half of 2025 alone, hitting KSh 558 billion by June. From a macro perspective, this massive aggregation of long-term domestic funds drastically improves Kenya’s capital self-reliance, offering a domestic alternative to volatile external borrowing.
The Short-Term Pain Points
On a microeconomic level, Phase Three sparked intense public debate. Combined with broader cost-of-living pressures, the increased deductions noticeably reduced employee take-home pay and heightened operational costs for businesses. This financial pressure led to a wave of Tier II “opt-outs,” where qualifying employers successfully redirected their Tier II contributions away from the NSSF and into certified private commercial schemes—consequently fueling a massive growth spurt across private fund managers.
6. NSSF’s Dominant Positioning and Record Returns
By December 2025, NSSF’s net assets expanded to KSh 623.79 billion, achieving an 11.78% growth rate in the final six months of the year. The state fund now controls between 20% and 23% of total industry AUM, making it the absolute gravitational center of Kenyan institutional investment.
NSSF Total Assets: KSh 623.79 Billion (Dec 2025)
┌──────────────────────────────────────┐
│  Government Securities (63.7%)       │█████████████████████████░░░░░░░░░░░░│
├──────────────────────────────────────┤
│  Quoted Equities (15.3%)             │██████░░░░░░░░░░░░░░░░░░░░░░░░░░░░░░░│
├──────────────────────────────────────┤
│  Immovable Property (6.4%)           │██░░░░░░░░░░░░░░░░░░░░░░░░░░░░░░░░░░░│
├──────────────────────────────────────┤
│  Eurobonds (6.1%)                    │██░░░░░░░░░░░░░░░░░░░░░░░░░░░░░░░░░░░│
├──────────────────────────────────────┤
│  Fixed Deposits & Others (8.5%)      │███░░░░░░░░░░░░░░░░░░░░░░░░░░░░░░░░░░│
└──────────────────────────────────────┘
To the surprise of many market analysts, the fund declared a historic 17% interest rate credited to member accounts for FY2024/25, a massive leap from the 11% distributed in the prior financial year. This historic payout was driven by net investment income bursting past the KSh 105 billion mark, quietening historical criticisms regarding the fund’s historical earning efficiency.
7. Deep Dive: Asset Allocation & Fixed Income Strategy
The NSSF investment portfolio relies heavily on a conservative, liability-driven approach designed to preserve capital while matching long-duration retirement liabilities.
Portfolio Diversification Breakdowns
As of the latter half of 2025, the allocation of assets demonstrates a highly traditional structure with an emerging pivot toward global diversification:
Government Securities (~63.7% / KSh 355 Billion): This remains the undisputed bedrock of the portfolio. High-yielding Kenyan Treasury Bonds and Bills provide highly predictable, risk-free cash flows perfectly aligned with long-term payouts.
Quoted Equities (~15.3%): Positioned in blue-chip equities on the Nairobi Securities Exchange (NSE), delivering strong dividend yields and capital gains as the local equity market staged a strong recovery in 2025.
Alternative Assets: Immovable property (real estate and land holdings) accounts for 6.4%, while Private Equity and Venture Capital comprise a modest but growing 1.3%.
The Eurobond Pivot: To hedge against local currency fluctuations and access international yields, NSSF aggressively scaled its exposure to Eurobonds, growing its holdings nearly five-fold to KSh 34.3 billion.
Strategic Outlook: Recognizing the concentration risk of holding nearly 79% of its total portfolio in a mix of domestic government debt and local listed equities, NSSF management has explicitly stated plans to cap government securities at 60%. This strategic shift will unlock tens of billions of shillings to be reallocated into infrastructure bonds, corporate real estate, and alternative asset classes. Notably, 93% of NSSF’s total assets are now outsourced to external, professional fund managers to ensure institutional-grade execution.
8. Strategic Analysis: Strengths, Challenges, and Risks
Strengths
Unrivaled Scale: The multi-trillion shilling size offers immense economies of scale and unparalleled bargaining power in private equity and sovereign debt negotiations.
Regulatory Maturity: The RBA’s strict enforcement has successfully mitigated historical issues of fund mismanagement.
Yield Generation: The recent 17% return demonstrates an impressive ability to outpace local inflation and deliver real wealth accumulation for members.
Challenges
The Informal Sector Void: Despite accounting for over 80% of Kenya’s working population, the informal sector (Jua Kali) remains largely locked out, with formal pension schemes primarily covering salaried corporate workers.
Unremitted Contributions: Several public entities, state corporations, and private firms continue to defer or delay remitting deducted pension contributions, threatening individual retirement pots.
The Cost-of-Living Backlash: Persistent economic strain leaves formal employees highly sensitive to any further increases in mandatory deductions.
Risks
Sovereign Debt Concentration: With over 60% of assets tied directly to government paper, the sector is heavily exposed to domestic fiscal health and sovereign rating shifts.
Interest Rate Volatility: A sudden drop in macro interest rates could quickly compress the yields available on new or rolling fixed-income instruments, making double-digit member returns harder to sustain.
9. Outlook and Future Prospects
The future of Kenya’s pension industry remains remarkably bullish. Propelled by the rollout of Phase Four contribution limits in early 2026, the overall sector is on track to cross KSh 3.2 trillion in AUM by the end of 2026.
For its part, the NSSF has set its sights on a historic corporate milestone: reaching KSh 1 trillion in standalone assets by 2027/28.
Long-term sustainability and reaching the next level of market maturity will heavily depend on three strategic pillars:
Digital Integration: Utilizing mobile money ecosystems (like M-Pesa) to seamlessly onboard, collect, and manage micro-contributions from millions of informal sector workers.
Alternative Investments: Safely deploying capital into high-impact infrastructure projects (PPP frameworks) and green energy solutions to diversify away from traditional government debt.
Governance Continuity: Maintaining rigorous, independent, and professional fund management practices to preserve public trust.
Based on the Retirement Benefits Authority (RBA) December 2025 Industry Brief, the National Social Security Fund (NSSF) significantly altered its asset allocation framework to streamline its external fund management mandate.
Between the 2024 period and the 2025 period, NSSF consolidated its massive external portfolio—which grew to Ksh 589.28 billion by December 2025 —by transitioning from six private fund managers down to a select group of three primary players.
An analysis of the top-performing private asset managers and approved issuers by AUM and growth reveals the following trends:
1. Top Fund Managers by AUM (External Portfolios)
Total assets managed by external fund managers stood at Ksh 2,217.75 billion in December 2025. The leading fund managers ranked by total AUM are:
Genafrica Asset Managers Limited: Continues to be the market leader with Ksh 703.68 billion under management. However, it recorded a 9% decline in total AUM during the six-month period, driven primarily by inter-manager portfolio transfers in a highly competitive market.
Co-Optrust Investment Services Limited: Ranked second, commanding Ksh 466.82 billion. It was one of the strongest performers of the period, achieving 24% growth from its June 2025 position of Ksh 376.85 billion.
African Alliance Kenya Asset Management Limited: Positioned third with Ksh 320.39 billion. It registered massive growth of 46% over the half-year.
Sanlam Investments East Africa Limited: Holds the fourth spot with an AUM of Ksh 316.32 billion, representing a solid 26% increase.
Old Mutual Investment Group Limited: Completes the top five with Ksh 227.01 billion, growing by 7%.
Notable Hyper-Growth Outside the Top 5:
CIC Asset Management Limited recorded the most explosive growth in the fund manager category, surging by 199% from Ksh 15.27 billion in June to Ksh 45.71 billion by December 2025.
ABSA Asset Management Ltd followed closely with 115% growth, pushing its AUM to Ksh 9.78 billion.
2. Top Approved Issuers (Guaranteed Funds)
Assets managed under Guaranteed Funds by approved insurance issuers grew by 5.34% to hit Ksh 522.39 billion by December 2025. High market concentration is also visible here, with the top five issuers commanding 84.34% of the market segment.
ICEA Lion Life Assurance Limited: Maintained market leadership in this category with an AUM of Ksh 126.18 billion, achieving a stable 5% growth.
The Jubilee Insurance Company of Kenya Limited: Ranked second with Ksh 119.13 billion, expanding by 8%.
Britam Life Assurance Company Kenya Limited: Holds third place with Ksh 77.27 billion, though it contracted by 7% over the half-year.
Kenindia Assurance Company Limited: Positioned fourth with Ksh 63.66 billion, showing a 7% gain.
GA Life Assurance Limited: Rounded out the top five with Ksh 50.36 billion, growing by 8%.
Fastest Growing Mid-Tier Issuers:
Pioneer Assurance Company Ltd demonstrated outstanding growth, jumping 47% to reach Ksh 13.18 billion.
Prudential Life Assurance Kenya also saw robust momentum, expanding its guaranteed portfolio by 23% to close at Ksh 3.88 billion.
3. Key Operational Drivers & Performance Insights
Inter-Manager Competition: The fluctuations in AUM among the tier-one managers (such as Genafrica’s dip versus Co-Optrust and African Alliance’s gains) were primarily driven by inter-manager transfers of existing schemes as institutional clients sought optimal asset placement. Similarly, variances among approved issuers were influenced by schemes moving assets in search of better guaranteed returns.
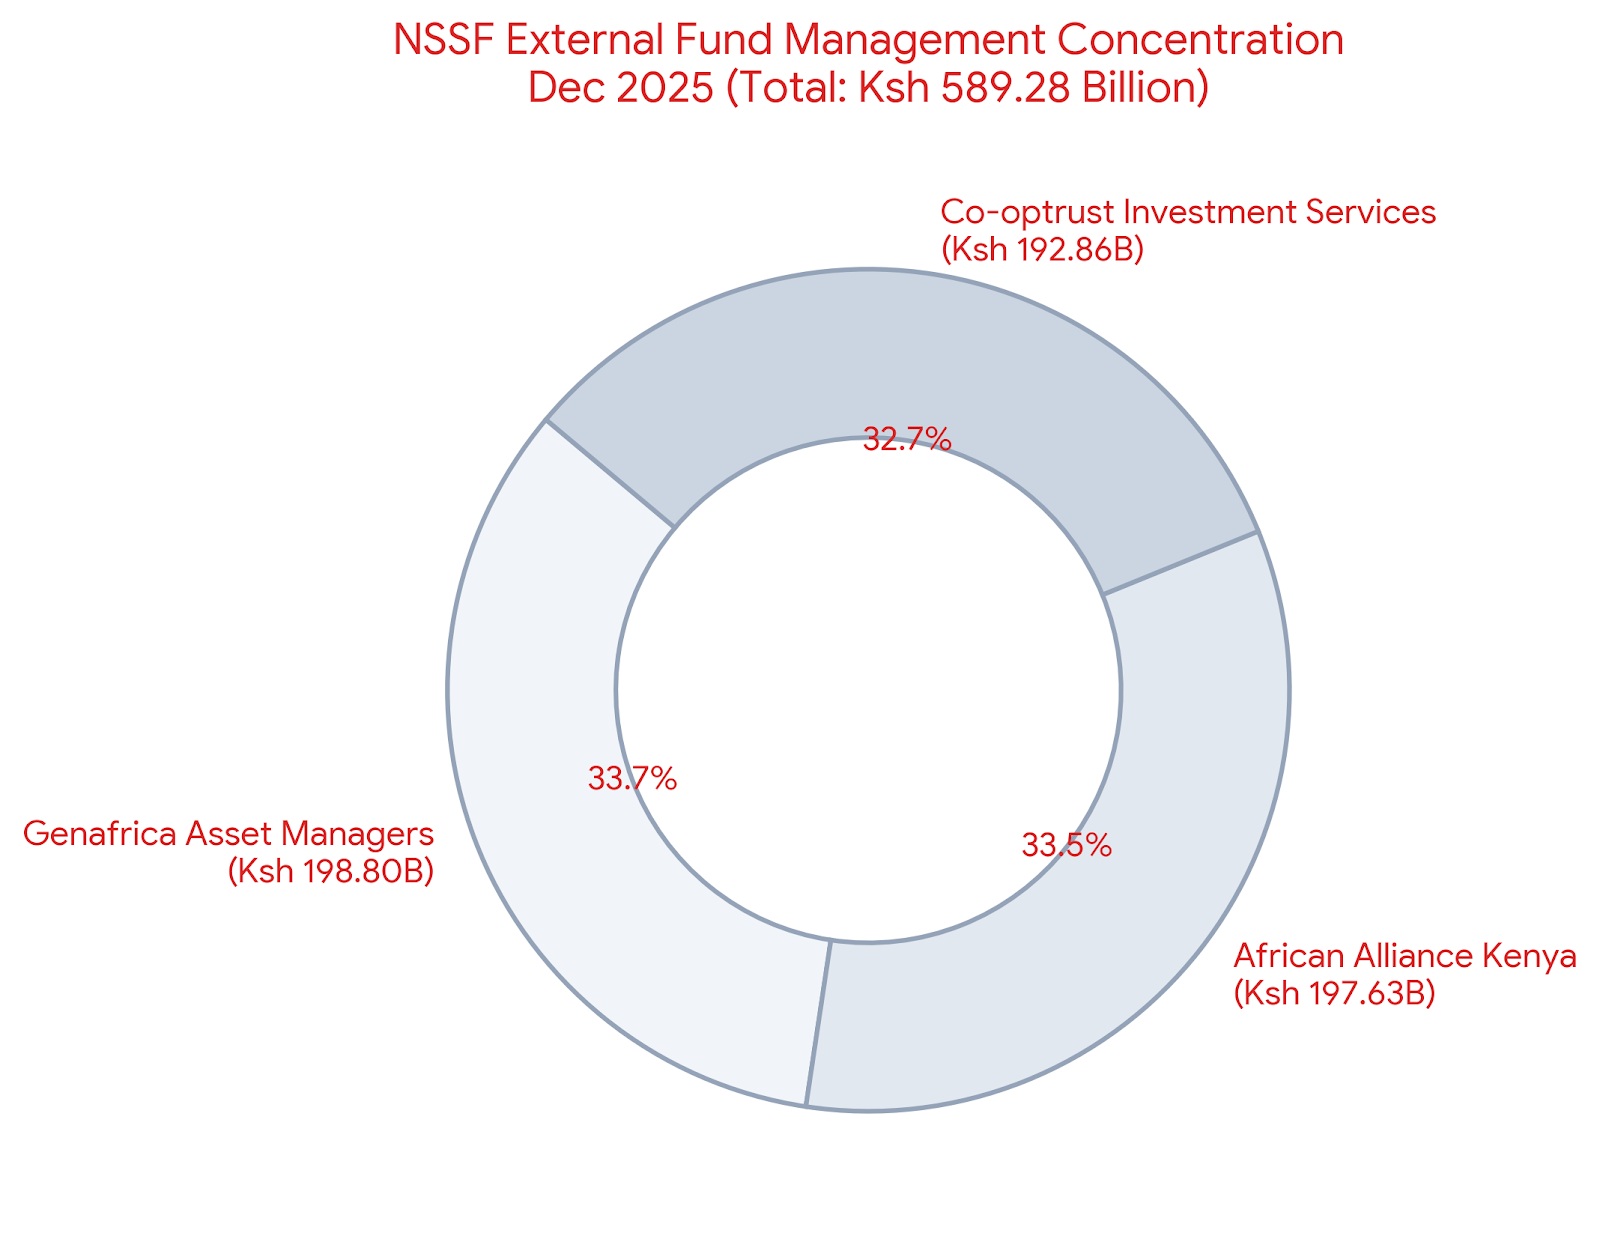
The NSSF Segregated Mandate Catalyst: Total NSSF net assets rose to Ksh 623.79 billion. Out of this, NSSF’s externally managed assets grew by 13.77% to Ksh 589.28 billion. These substantial public funds are split among private managers, serving as a huge booster to the top-performing players. Specifically, Genafrica held Ksh 198.80 billion of NSSF’s money, African Alliance held Ksh 197.63 billion, and Co-Optrust held Ksh 192.86 billion, heavily underwriting their market dominance.
Macro Shift and Yield Re-optimization: The central bank lowered the Central Bank Rate (CBR) to 9.0% by December 2025. Because traditional fixed income and government securities yields began declining, the report notes a structural shift where fund managers are increasingly looking to optimize long-term returns by building exposure in alternative assets (like Private Equity, infrastructure bonds like the LINZI IABS, and Shariah-compliant vehicles).
Based on the Retirement Benefits Authority (RBA) December 2025 Industry Brief, the National Social Security Fund (NSSF) significantly altered its asset allocation framework to streamline its external fund management mandate.
Between the 2024 period and the 2025 period, NSSF consolidated its massive external portfolio—which grew to Ksh 589.28 billion by December 2025 —by transitioning from six private fund managers down to a select group of three primary players.
A comparative breakdown of the private fund managers handed the mandate to manage NSSF funds indicates distinct strategies across the two periods:
1. Active Mandates Retained in both 2024 and 2025
Three private asset managers consistently retained their mandates, benefiting from massive asset inflows heavily accelerated by the ongoing implementation of the NSSF Act, 2013:
Genafrica Asset Managers Limited: Maintained a continuous upward trajectory. Their NSSF portfolio grew from Ksh 70.83 billion (June 2024) to Ksh 133.49 billion (December 2024), and steadily advanced throughout 2025 to close at Ksh 198.80 billion.
African Alliance Kenya Asset Management Limited: Witnessed a sharp surge in their allocation over the comparison window, leaping from Ksh 77.91 billion (June 2024) to Ksh 171.73 billion (December 2024), finishing the 2025 year at Ksh 197.63 billion.
Co-optrust Investment Services Limited: Saw substantial scaling in their external mandate. Their NSSF portfolio stood at Ksh 63.99 billion in June 2024, grew to Ksh 119.38 billion by December 2024, and surged up to Ksh 192.86 billion by December 2025.
2. Mandates Terminated or Consolidated by 2025
The defining structural shift between the two fiscal timelines was NSSF’s decision to exit three fund managers entirely after mid-2024, reallocating those assets among the surviving three managers listed above:
Old Mutual Investment Group Limited: Managed Ksh 62.35 billion for NSSF as of June 2024, but held Ksh 0 (no active mandate) throughout 2025.
Sanlam Investments East Africa Limited: Held an NSSF portfolio of Ksh 36.18 billion in June 2024, which was fully wound down to Ksh 0 in 2025.
CIC Asset Management Limited: Held an allocation of Ksh 37.43 billion in June 2024, which was also exited completely to Ksh 0 by the 2025 reporting intervals.
Based on the Retirement Benefits Authority (RBA) December 2025 Industry Brief, a distinct contrast emerges when comparing the standalone performance and asset placement of the National Social Security Fund (NSSF) versus Private Pension Schemes (inclusive of occupational, segregated, and umbrella commercial schemes).
The comparative evaluation across your three specific matrices reveals the following insights:
1. Assets Under Management (AUM) Growth
The implementation of the NSSF Act, 2013, has driven massive capital deployment into the retirement ecosystem, but the scale and velocity of expansion vary between the public and private pillars:
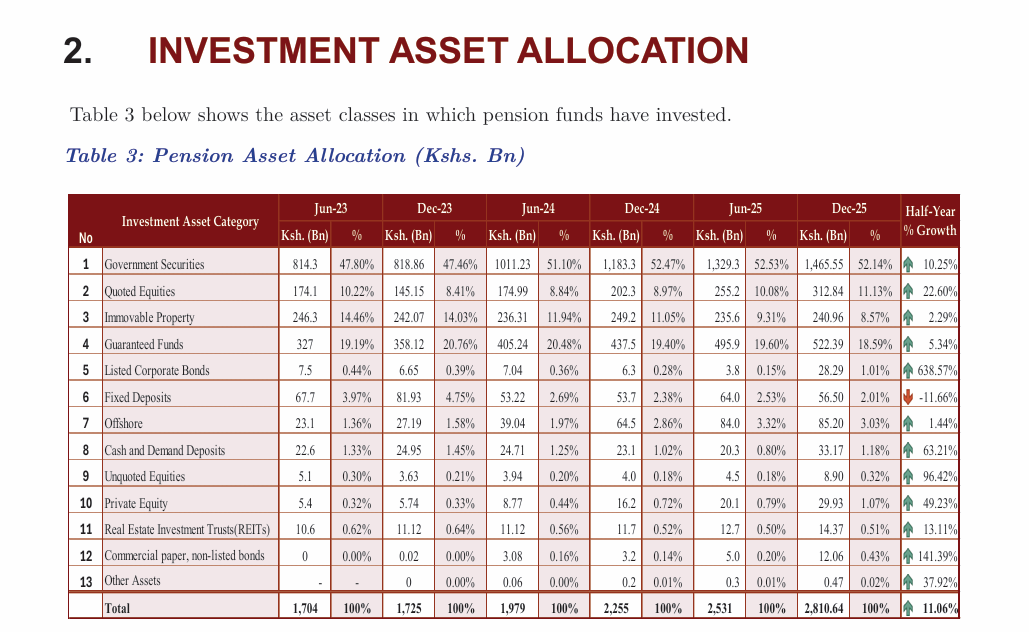
Overall Industry context: Total pension sector assets expanded by 11.06% over the half-year to close at Ksh 2,810.64 billion.
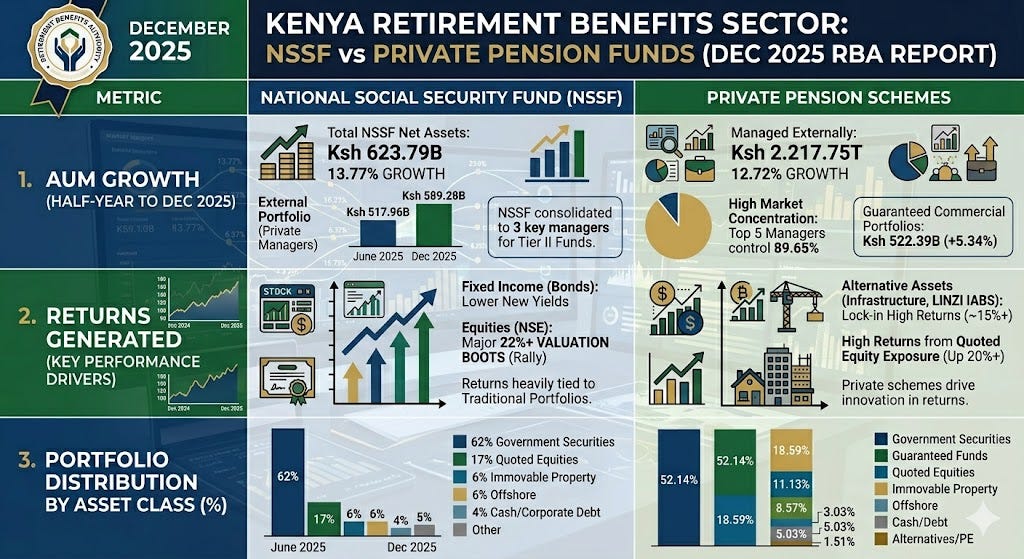
NSSF Growth: Outpaced private peers significantly. Total NSSF net assets expanded by 11.78% in just six months to reach Ksh 623.79 billion. Strikingly, its externally managed portfolio (funds allocated to private asset managers) skyrocketed by 13.77% over the half-year, jumping from Ksh 517.96 billion to Ksh 589.28 billion. This reflects a steady, non-discretionary influx of Tier I and Tier II statutory contributions from employers.
Private Pension Growth: While still growing robustly, private schemes expanded at a slightly more moderated pace. Total assets managed by external fund managers (which includes private schemes alongside the outsourced NSSF funds) grew by 12.72% to close at Ksh 2,217.75 billion. Guaranteed commercial portfolios managed by insurance firms grew by 5.34% over the period to hit Ksh 522.39 billion. Fluctuations among individual private players were heavily driven by aggressive “inter-manager transfers”—meaning schemes switching fund managers in search of better terms rather than entirely new organic market inflows.
2. Returns Generated
The macroeconomic environment in late 2025 shifted dramatically due to the central bank lowering the Central Bank Rate (CBR) down to 9.0%. This directly impacted how yields trickled down:
Fixed Income Returns: Because both private funds and NSSF hold a majority of their wealth in Government Securities, both segments experienced a flattening of new interest income as yields on freshly issued government debt dropped.
Equity Returns (Valuation Gains): Both NSSF and private portfolios experienced massive valuation boosts via the stock market. The Nairobi Securities Exchange experienced an extraordinary rally in blue-chip counters (Safaricom, EABL, and tier-1 banks like Equity and KCB). The NASI index soared 22% and the NSE 20-Share Index rose 29% in six months, acting as a primary driver for the overall industry’s Ksh 122.87 billion in investment income and valuation gains.
NSSF vs. Private Strategy Outcomes: Private pensions achieved a marginal return edge in alternative asset classes. Private schemes aggressively snapped up high-yielding infrastructure papers like the 15-year LINZI 003 Infrastructure Asset-Backed Security (IABS), which locks in a fixed return of 15.04%. NSSF returns, conversely, remained heavily tied to traditional, ultra-conservative portfolios, with a minor share filtering into specialized asset returns.
3. Distribution of Portfolio Across Asset Classes
The most definitive contrast between private schemes and NSSF lies in asset allocation structures and risk appetites:
Government Securities: NSSF maintains a much higher concentration here, locking 62% (Ksh 379.85 billion) of its investment portfolio directly into government debt instruments. Private pension schemes sit lower, averaging a 52.14% exposure industry-wide.
Quoted Equities: Private pension portfolios hold an average allocation of 11.13% in publicly traded stocks. NSSF takes a significantly more aggressive posture on public equities, holding 17% (Ksh 107.56 billion) of its capital in listed preference and ordinary shares.
Immovable Property (Real Estate): Private schemes have progressively cut back on real estate due to liquidity concerns, bringing their total real estate allocation down to 8.57%. NSSF is even leaner on property, maintaining a defensive 6% (Ksh 38.08 billion) asset allocation in real estate.
Offshore Allocations: NSSF has utilized its size to globalize its risk, positioning 6% (Ksh 34.15 billion) of its portfolio into offshore investments to hedge against local economic shifts. Private pensions are far behind on geographical diversification, retaining a minimal 3.03% allocation offshore.
Guaranteed Funds: This is a purely private phenomenon. Smaller private/occupational schemes allocate a massive 18.59% (Ksh 522.39 billion) of the private sector’s wealth into cash-guaranteed instruments provided by life insurance firms to avoid market volatility. NSSF utilizes zero commercial guaranteed funds, as it operates as its own statutory guarantor.
Alternative and Venture Capital Assets: Private schemes are driving the industry’s shift into alternative investments. Private schemes scaled up listed corporate bonds by 638% (capturing the Linzi Stadium bond) and pushed aggressively into Private Equity (Ksh 29.93 billion). NSSF holds less than 1% of its massive asset base in private equity, commercial papers, and REITs combined.
Summary Matrix Comparison (%)
The Invisible Monopolies: Debt, Smooth Returns, and Stadium Bonds
The latest Retirement Benefits Authority (RBA) data for December 2025 doesn’t just show growth; it reveals a fundamental redirection of Kenya’s financial architecture. What was once intended to be a pool of patient, diversified capital for private-sector expansion has been quietly repurposed. We are witnessing the birth of “Invisible Monopolies”—a structural convergence where the bulk of the nation’s retirement wealth is being funneled into three specific channels that prioritize sovereign and institutional stability over broad economic participation.
The Silent Underwriter: How Your Pension Became the Treasury’s Biggest Lifeline
The latest Retirement Benefits Authority (RBA) data for December 2025 paints a picture of a sector that has fundamentally shifted its purpose. Retirement benefits, historically intended to be a pool of patient capital for private-sector development, have been quietly repurposed into the most reliable financing arm for the National Treasury.
The Numbers That Tell the Story
As of December 2025, the Kenyan retirement benefits industry reached a total Assets Under Management (AUM) of Ksh 2.81 Trillion. Of this massive wealth, 52.14%—or Ksh 1.47 Trillion—is locked directly into Government Securities. To understand the systemic weight of this, we must look at the macro picture. According to Central Bank of Kenya (CBK) data, Kenya’s total domestic debt stock stands at approximately Ksh 7.24 Trillion.
By simple arithmetic, the pension industry now directly underwrites over 20% of the entire Kenyan domestic debt stock.
The “Crowding Out” Mechanism
This concentration is more than just a portfolio allocation quirk; it is a textbook case of the “crowding out” effect in action. When fund managers—who have a fiduciary duty to maximize returns for retirees—allocate more than half of their portfolios to sovereign debt, two major consequences follow:
Starving the Real Economy: Every shilling locked into a government bond is a shilling not being deployed into local corporate bonds, venture capital for SMEs, agricultural processing, or real estate development. By opting for the “safe” yields of the state, fund managers are effectively participating in the systemic starvation of the private sector, which lacks access to the same volume of long-term, low-cost capital.
The Sovereign Trap: We have created a circular feedback loop. The stability of the average Kenyan’s retirement is now inextricably linked to the fiscal health of the government. If the state faces a liquidity crunch or fiscal volatility, it doesn’t just affect the macroeconomy—it directly impairs the solvency and growth of the private pension funds that have underwritten the state’s deficit.
Why This Matters
For years, the pension industry has been heralded as the “engine of development” for Kenya’s capital markets. However, the Dec 2025 data suggests that this engine is currently idling in neutral, tasked primarily with keeping the Treasury’s lights on.
When one-fifth of the nation’s domestic debt is held by pension funds, the “risk-free” label often attached to government bonds begins to blur. We are no longer just looking at a retirement sector; we are looking at a crucial pillar of public finance that has been subsumed into the state’s debt management strategy. For the average contributor, the question remains: Are you saving for your future, or are you inadvertently financing the state’s present?
How do you feel about your pension fund having a 20% stake in the national domestic debt? Is it a sign of stability, or a structural risk we aren’t talking about enough? Let me know in the comments below.
The “Crowding Out” Mechanism
This concentration is more than just a portfolio allocation quirk; it is a textbook case of the “crowding out” effect in action. When fund managers—who have a fiduciary duty to maximize returns for retirees—allocate more than half of their portfolios to sovereign debt, two major consequences follow:
Starving the Real Economy: Every shilling locked into a government bond is a shilling not being deployed into local corporate bonds, venture capital for SMEs, agricultural processing, or real estate development. By opting for the “safe” yields of the state, fund managers are effectively participating in the systemic starvation of the private sector, which lacks access to the same volume of long-term, low-cost capital.
The Sovereign Trap: We have created a circular feedback loop. The stability of the average Kenyan’s retirement is now inextricably linked to the fiscal health of the government. If the state faces a liquidity crunch or fiscal volatility, it doesn’t just affect the macroeconomy—it directly impairs the solvency and growth of the private pension funds that have underwritten the state’s deficit.
Why This Matters
For years, the pension industry has been heralded as the “engine of development” for Kenya’s capital markets. However, the Dec 2025 data suggests that this engine is currently idling in neutral, tasked primarily with keeping the Treasury’s lights on.
When one-fifth of the nation’s domestic debt is held by pension funds, the “risk-free” label often attached to government bonds begins to blur. We are no longer just looking at a retirement sector; we are looking at a crucial pillar of public finance that has been subsumed into the state’s debt management strategy. For the average contributor, the question remains: Are you saving for your future, or are you inadvertently financing the state’s present?
How do you feel about your pension fund having a 20% stake in the national domestic debt? Is it a sign of stability, or a structural risk we aren’t talking about enough? Let me know in the comments below.
2. The Guaranteed Fund Moat: Where Returns Go to “Smooth” Out
While the NSSF mandate captures headlines, the silent giant of the industry remains the Ksh 522 Billion held in Guaranteed Funds. These products, managed predominantly by large insurance companies, have become a “moat” that obscures market reality.
The controversy here is one of information asymmetry. These funds offer the promise of principal protection, but at the cost of transparency. In a market rally, when underlying assets like stocks or bonds perform exceptionally well, these insurance entities often apply “return smoothing” policies. They hoard the excess gains to build internal reserves, passing only a modest, single-digit return to the retirees. The result? A half-trillion-shilling pool where the upside is captured by the insurance balance sheet, and the retiree is left with a return that often struggles to keep pace with inflation.
3. Stadium Bonds and the Mirage of “Alternatives”
Finally, we must scrutinize the so-called “diversification” into Corporate Bonds and Commercial Paper. The RBA report celebrates a 638% surge in corporate bonds, but this is a statistical mirage driven by extreme concentration.
The growth was sparked almost entirely by the Ksh 18.12 Billion LINZI 003 Infrastructure Asset-Backed Security—a stadium bond used to finance the construction of the Talanta Sports Stadium. When we see headlines about pension funds moving into “alternatives,” we are often seeing the state using pension capital to bridge the financing gaps of high-stakes, state-aligned infrastructure projects.

The Bottom Line
These three pillars—the massive sovereign debt exposure, the opaque insurance-managed guaranteed funds, and the concentration in state-aligned infrastructure—form a closed-loop ecosystem.
For the average contributor, the takeaway is sobering: your retirement is currently functioning less as an investment portfolio and more as a systemic stabilizer for the state. The “Invisible Monopolies” aren’t just managing your money; they are managing the financial survival of the government’s current fiscal path. The question for the next decade is whether this concentration of risk will prove to be a masterstroke of institutional stability, or if we have built an ecosystem that is far more fragile than our quarterly reports suggest.
10. Conclusion
Kenya’s pension sector has successfully transformed from a modest, low-yielding provident fund system into a multi-trillion-shilling powerhouse of domestic savings and investment. The intersection of bold structural legislative reforms, strict regulatory oversight by the RBA, and an evolving investment matrix has created an East African financial success story. While navigating macroeconomic pressures and bridging the informal sector gap will require innovative solutions, the industry stands firmly prepared to anchor both Kenya’s long-term developmental funding and the retirement security of its citizens for generations to come.