
1. Executive Summary
Market Vitality & Investor Inflow
The Shift in Asset Strategy: MMFs vs. Special Funds
Growth Outliers: Top Performers
2. The Licensing Regime & New Market Entrants
Evolution of Market Entry under the 2025 Regulations
Recent Licensing Activity and Product Diversification
3. The Transparency Crisis: The Urgent Call for Standardized Reporting
The Investor Outcry: Why Standardized Metrics Matter
Advocacy for Regulatory Accountability: Engaging the CMA
4. Detailed Analysis: Special Funds Growth, Performance & Portfolio Strategy
Mansa-X Special Funds (Portfolio Structure & Anomalies)
OAK Special Funds (Growth Drivers & Alternative Allocation)
ARVOCAP Special Funds (Global-First Strategy & Risk)
Etica Special Funds (Concentration & Liquidity Risks)
Madison Special Wealth Fund (Liquidity & Operational Anomalies)
5. The Scalability Challenge: The Future of Small-Scale Managers
The Economics of Sub-Scale Management
Breakdown of Funds with < KES 1 Billion AUM
The Break-Even Question
Appendix: Sector Data Aggregates
Table 4: CIS with less than KES 1 billion AUM
Special Funds Portfolio Distribution Table
The Boardlot Quarterly: Kenya CIS Report & Market Intelligence (Q1 2026)
(Featuring MMFs & Special Funds Market Analysis)
Executive Summary Welcome to the inaugural edition of the Boardlot Quarterly. Each quarter, we will synthesize the latest regulatory data to provide an objective, data-driven look at the Kenyan Collective Investment Scheme (CIS) landscape. As we look at Q1 2026, the data indicates a market at a crossroads—marked by aggressive AUM growth but haunted by growing questions of transparency and systemic risk.
1. Market Vitality & Investor Inflow
The Collective Investment Scheme (CIS) sector has demonstrated impressive resilience in the first quarter of 2026, with overall Assets Under Management (AUM) growing by 13%. This expansion reflects a robust appetite for regulated investment vehicles across the local market.
Retail Expansion: Driven by broader financial inclusion, the investor base expanded by approximately 12.5%. The number of participants rose from 3,224,130 in December 2025 to 3,626,006 by March 2026.
Drivers of Growth: This significant surge in participation is attributed to a combination of strong, aggressive marketing campaigns deployed by fund managers and the entry of newly licensed actors into the market.
Market Dominance: Despite the influx of new participants, a notable concentration persists at the top of the industry. Five managers—Sanlam, Standard, CIC, Britam, and NCBA—continue to control over 63% of the total market share.
2. The Shift in Asset Strategy (MMFs vs. Special Funds)
While Money Market Funds (MMFs) continue to maintain the largest portion of the total market, the capital flow throughout this quarter signals a definitive investor pivot toward higher-yield, more complex investment strategies.
The Yield Hunt: During Q1 2026, investors injected KES 2.3 billion into MMFs, while a massive KES 41 billion flowed into Special Funds. This stark disparity underscores that Special Funds have rapidly become the preferred vehicle for local capital deployment.
Category Leaders & Dominance:
Fixed Income: NCBA, Sanlam, Britam, and CIC maintain their lead, collectively commanding a significant majority of the category’s Assets Under Management (AUM).
Equity Funds: Leadership is held by ARVOCAP, NCBA, and Old Mutual, who together control the largest percentage of total Equity fund AUM.
Special Funds: While Mansa-X remains the dominant player by volume, holding the largest individual market share within the Special Funds category, OAK has emerged as the fastest-growing special fund, rapidly increasing its percentage of category AUM.
The Offshore Diversification Gap: Reality vs. Perception
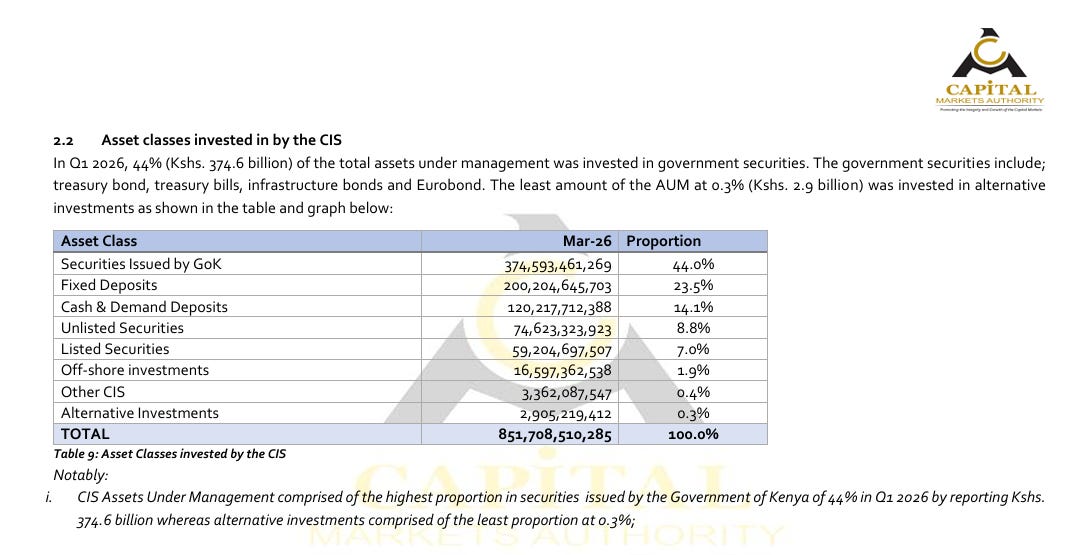
There is a persistent narrative, often perpetuated in fund marketing, that “Special Funds” are the key vehicle for accessing high-growth global opportunities and achieving true geographic diversification. However, the data reveals a stark disconnect between this perception and reality. Offshore investments account for a mere 1.9% of the total CIS Assets Under Management. While investors are increasingly migrating toward these specialized vehicles under the impression that their capital is being deployed to capture global alpha, the actual allocation confirms that the industry remains overwhelmingly anchored in the domestic market, with 44% of assets concentrated in Securities Issued by the Government of Kenya. This discrepancy suggests that the “offshore” marketing appeal of many Special Funds may be significantly overstated, leaving investors to wonder if they are truly getting the international exposure they are paying for.
3. Growth Outliers (Top Performers)
Several funds are drastically outpacing industry averages this quarter, warranting closer scrutiny of their specific growth drivers and operational mandates:
Faida Unit Trust Funds: Recorded an exceptional 71% growth, with AUM rising from KES 9.2 billion to KES 15.7 billion.
CPF Unit Trust Scheme: Achieved 69% growth, increasing its AUM from KES 3.3 billion to KES 5.6 billion.
Ziidi Shariah Money Market Fund: Experienced 67% growth, expanding its AUM from KES 68.2 million to KES 113.9 million.
Gulfcap Unit Trust Funds: Saw 63% growth, with AUM moving from KES 856.3 million to KES 1.39 billion.
Arvocap Unit Trust Funds: Recorded 39% growth, increasing from KES 7.9 billion to KES 11.0 billion.
2. The Licensing Regime & New Market Entrants
Licensing Regime and Market Expansion
The landscape for collective investment schemes in Kenya is undergoing a significant transformation, driven by the implementation of the Capital Markets (Licensing Requirements) (General) Regulations, 2025. This new framework, which became operational in early 2026, has introduced a more rigorous yet structured environment for market participants.
Evolution of Market Entry
To enhance financial stability and institutional quality, the Capital Markets Authority (CMA) has recalibrated capital requirements for fund managers, now necessitating shareholders’ funds of at least KES 20 million. Key updates to the licensing regime include:
Approval-in-Principle: A new procedural stage that offers greater predictability for prospective entrants before full licensing.
Continuous Supervision: A shift from periodic reporting to a proactive, risk-based regime requiring market intermediaries to submit monthly capital adequacy reports and management accounts within 15 days of each month-end.
Expanded Regulatory Perimeter: New categories have been introduced, including licenses for Intermediary Service Platform Providers—targeting digital aggregators and distributors—and the formal licensing of Robo-advisory firms under the expanded investment advisor definition.
Recent Market Entrants and Activity
The surge in individual investor participation—which saw unit trust investor numbers nearly double in the past year—has prompted the CMA to fast-track approvals for both new managers and additional sub-funds. Notable developments in 2026 include:
New Licensing: Firms such as Mema Asset Management Limited have been granted fund manager licenses to provide services to institutional and high-net-worth clients.
Product Diversification: The industry saw one of its largest single-round approvals in May 2026, with the CMA authorizing 16 new investment funds across six asset management firms.
Strategic Growth: Market players like EDC Asset Management (Kenya) Limited have entered the market with a broad, multi-fund umbrella structure, while existing players like Capital A Investment Bank and CPF Asset Managers have aggressively expanded their offerings with new special funds focused on multi-asset and alternative investment strategies.
These moves reflect a broader industry transition toward actively managed, specialized products that offer diversification beyond traditional banking or standard money market instruments. Existing licensees have until December 11, 2026, to ensure full compliance with the new regulatory requirements.
3. The Transparency Crisis: The Urgent Call for Standardized Reporting
As assets flow into complex “Special Funds,” the gap between sophisticated portfolio strategies and simplistic, inconsistent disclosures has reached a breaking point. Investors are increasingly utilizing social media platforms to voice frustration regarding the lack of transparency in portfolio composition, asset valuations, and underlying risk profiles.
The Investor Outcry
The current reporting environment, characterized by infrequent updates and broad categorization, has fueled a wave of public discourse. Investors are increasingly demanding:
Granular Disclosure: A move away from opaque groupings (e.g., “Other Assets”) toward detailed, asset-level breakdowns that reveal genuine exposure.
Standardized Valuation: Greater clarity on the methodology used to value unlisted and alternative assets, which currently represent significant portions of fund portfolios but remain difficult for retail investors to verify.
Operational Transparency: A clear articulation of liquidity management practices, particularly given the near-zero cash buffers maintained by several top-tier funds.
Advocacy for Regulatory Accountability
Recognizing that individual investor grievances are symptomatic of systemic reporting flaws, there is a mounting push to formalize these demands at the regulatory level. To bridge this gap, specific actions have been taken to challenge the status quo:
Formal Regulatory Engagement: A formal letter has been submitted to the Capital Markets Authority (CMA) outlining the pressing need for a modernized, standardized reporting framework that mandates monthly, detailed portfolio disclosures for all Special Funds.
Public Discourse: These concerns, alongside a comparative analysis of the sector’s current reporting failures, have been published to the broader financial community via the Board Lot Substack.
The objective of this advocacy is to shift the industry from a “trust-based” model to a “verification-based” model. Without unified, transparent reporting standards, the rapid growth of Special Funds risks eroding the very market confidence that has fueled the sector’s impressive Q1 2026 performance.

4. Detailed Analysis: Special Funds Growth, Performance & Portfolio Strategy
As Special Funds cement their position as the preferred vehicle for capital deployment, individual fund strategies have become increasingly distinct.
I. Detailed Analysis: Mansa-X Funds
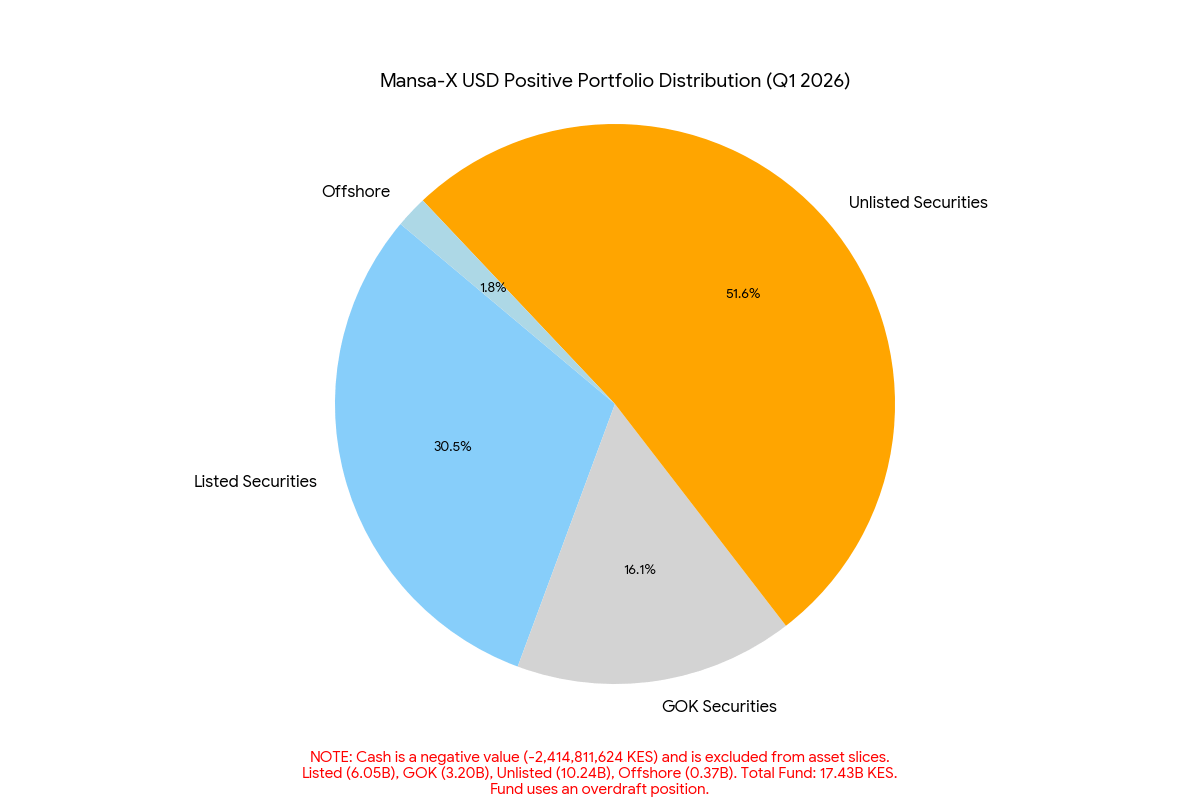
Mansa-X KES Fund
Portfolio Strategy: This fund maintains a diversified structure across Listed Securities (34%), Unlisted Securities (28%), and GOK Securities (22%), with a healthy Cash (15%) buffer.
Anomalies: The primary observation here is the massive allocation to Unlisted Securities (KES 36.8 billion). While this drives performance, it creates a significant valuation and liquidity challenge, as over a quarter of the fund’s AUM is invested in assets that lack a transparent, daily-traded market.
Mansa-X USD Fund
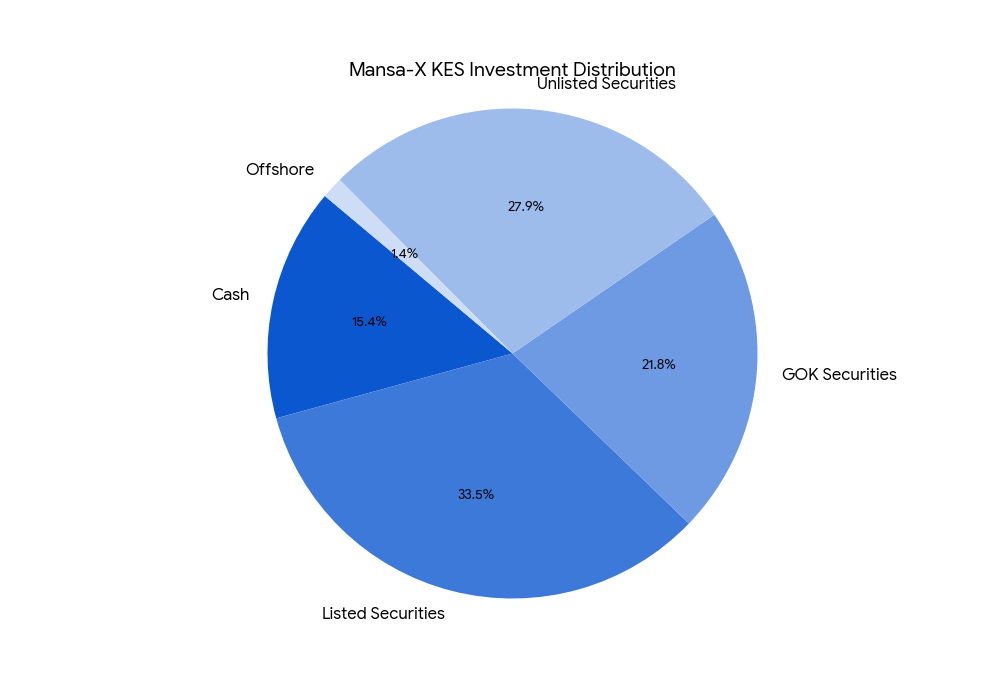
Portfolio Strategy: This fund is heavily aggressive, with a massive 59% allocation in Unlisted Securities and 35% in Listed Securities.
Anomalies: The fund reports a negative cash position of -14% (KES -2.4 billion).
MANSA Sharia Fund
Portfolio Strategy: This fund is almost entirely concentrated in Unlisted Securities (approx. 67%) and Listed Securities (approx. 37%), with no exposure to GOK Securities.
Anomalies: The fund reports a negative cash position (KES -136.6 million). Similar to the USD fund, the negative cash position, combined with a total lack of liquid government paper, suggests that the fund’s liquidity is entirely dependent on the performance and marketability of its underlying unlisted holdings
Summary of Strategic Risks
Liquidity Strain: Across all three funds, the heavy reliance on Unlisted Securities creates a structural vulnerability. When combined with the negative cash balances in the USD and Sharia funds, it indicates that Mansa-X is operating with an extremely thin margin of safety, relying on high-risk, illiquid assets to satisfy investor liquidity demands.
Valuation Transparency: The massive volumes held in unlisted instruments raise questions regarding mark-to-market accuracy, as these assets are inherently difficult to price compared to the listed and GOK security portions of the portfolio.
II. Detailed Analysis: OAK Special Funds
Portfolio Strategy
OAK’s strategy is characterized by significant diversification, moving beyond simple domestic fixed-income models to capture international and alternative growth opportunities.
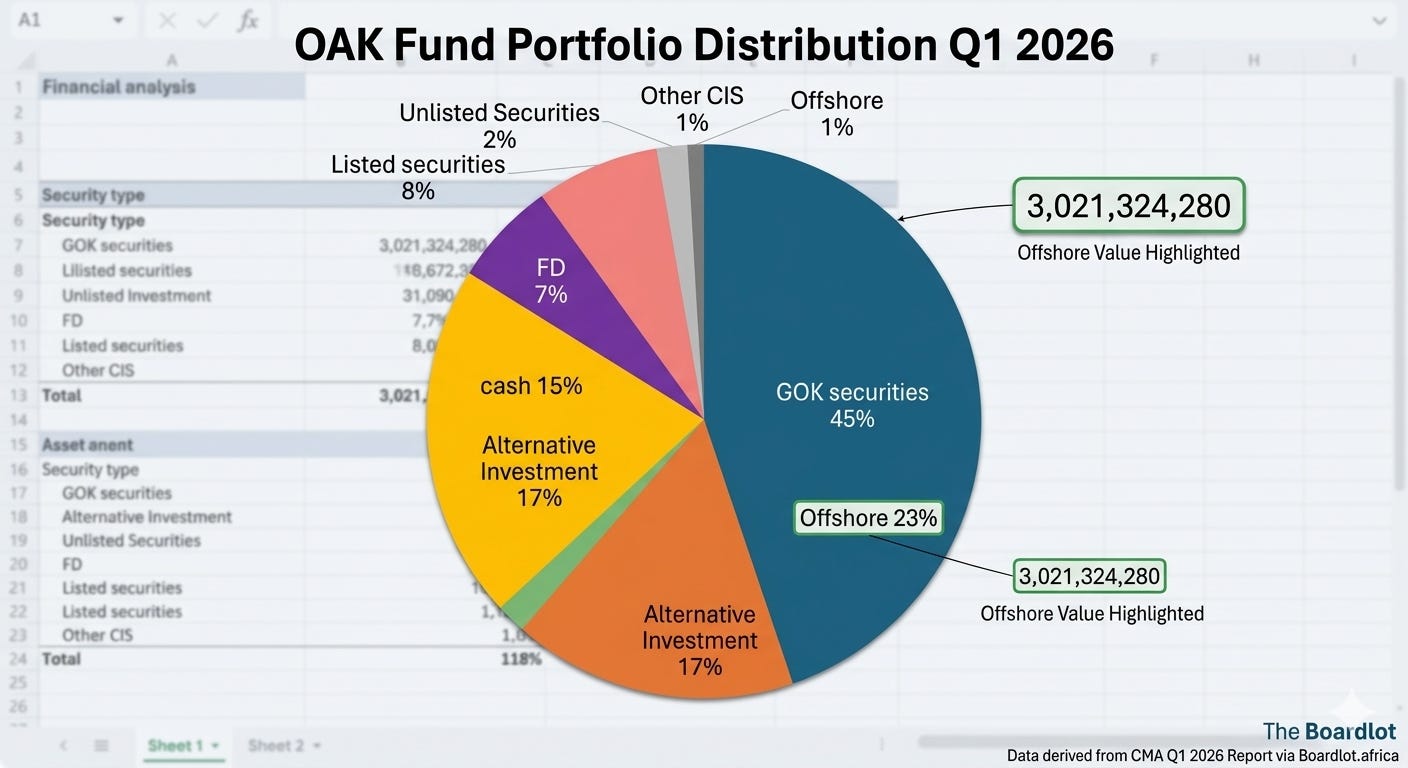
Core Allocation: The largest portion of the portfolio is invested in GOK Securities (45%), totaling KES 6.0 billion, which provides a stable, yield-generating foundation for the fund.
International & Alternative Exposure: OAK has strategically allocated 23% (KES 3.0 billion) to Offshore investments and 17% (KES 2.3 billion) to Alternative Investments. This combined 40% allocation is highly aggressive and suggests a mandate focused on hedging against local economic cycles and seeking high-alpha returns in non-traditional asset classes.
Liquidity Management: The fund maintains a robust liquidity buffer, with Cash (15%) and Fixed Deposits (7%) totaling 22% of its AUM. This is a prudent approach, particularly given its high exposure to less liquid offshore and alternative assets.
Strategic Anomalies & Risk Profile
Alternative Investment Concentration: The 17% allocation to Alternative Investments is a notable outlier. Unlike listed securities, alternative investments often involve complex valuations, longer lock-in periods, and reduced transparency. For a fund experiencing such rapid growth, this level of exposure suggests a high-risk mandate that may become difficult to value or liquidate during periods of market stress.
Complexity Risk: With nearly 40% of the fund distributed across Offshore and Alternative assets, OAK’s portfolio is significantly more complex than those of its peers. While this strategy appears to be driving its status as the fastest-growing fund, it introduces substantial exposure to foreign exchange risk and the performance variability of alternative, private assets.
Market Penetration Strategy: The aggressive allocation to growth-oriented assets (Offshore/Alternatives) serves as a differentiator, likely attracting investors who are moving away from the lower-yielding, traditional MMFs. The primary risk is whether the fund’s operational management can sustain the valuation of these complex assets as the total AUM continues to scale rapidly
III. Detailed Analysis: ARVOCAP Special Funds
Portfolio Strategy & Observations
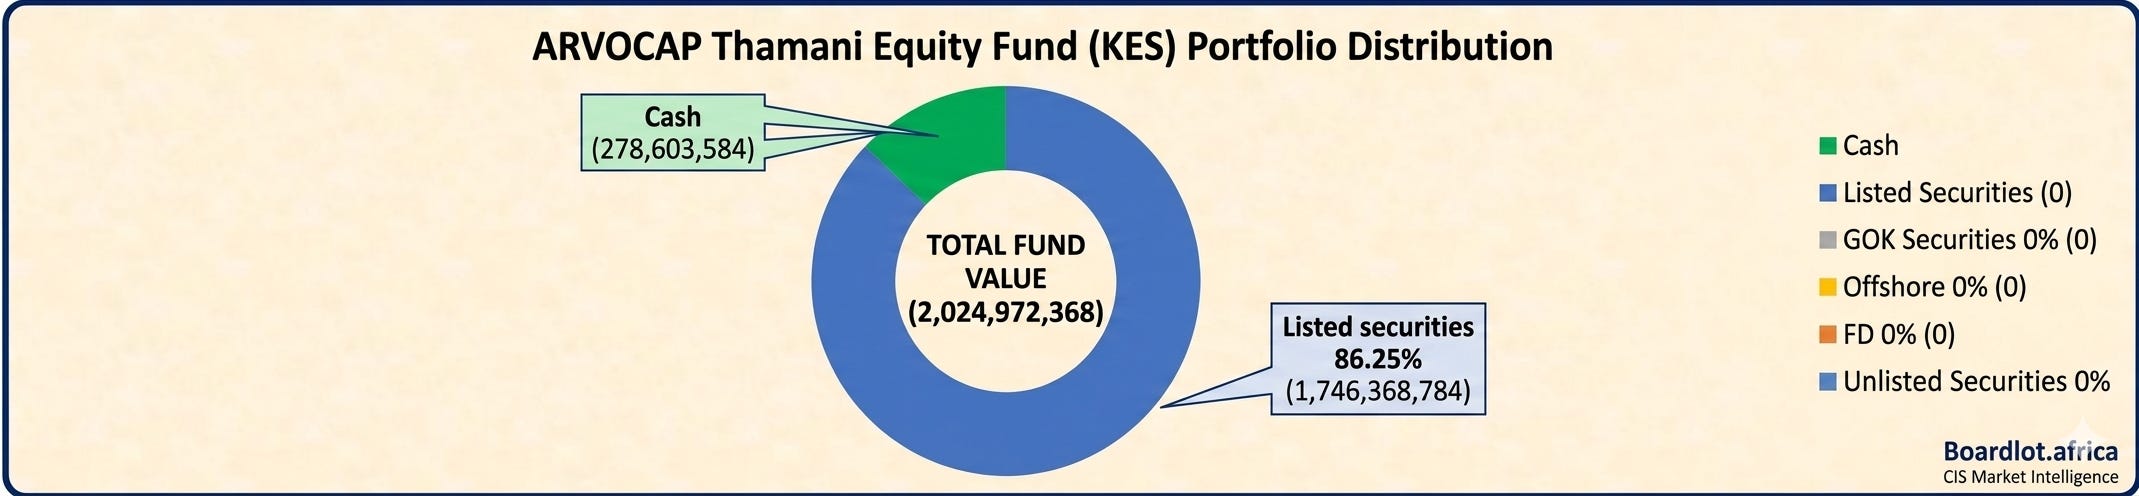
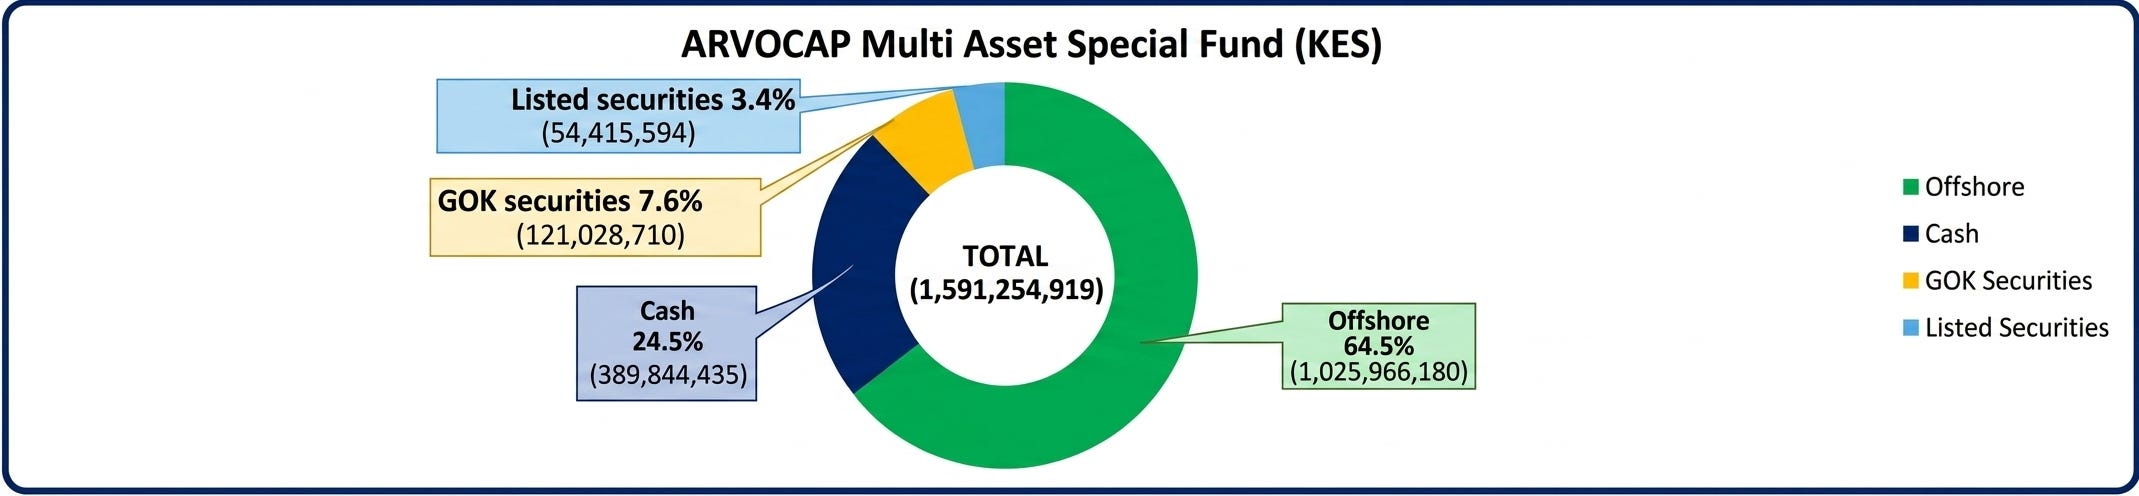
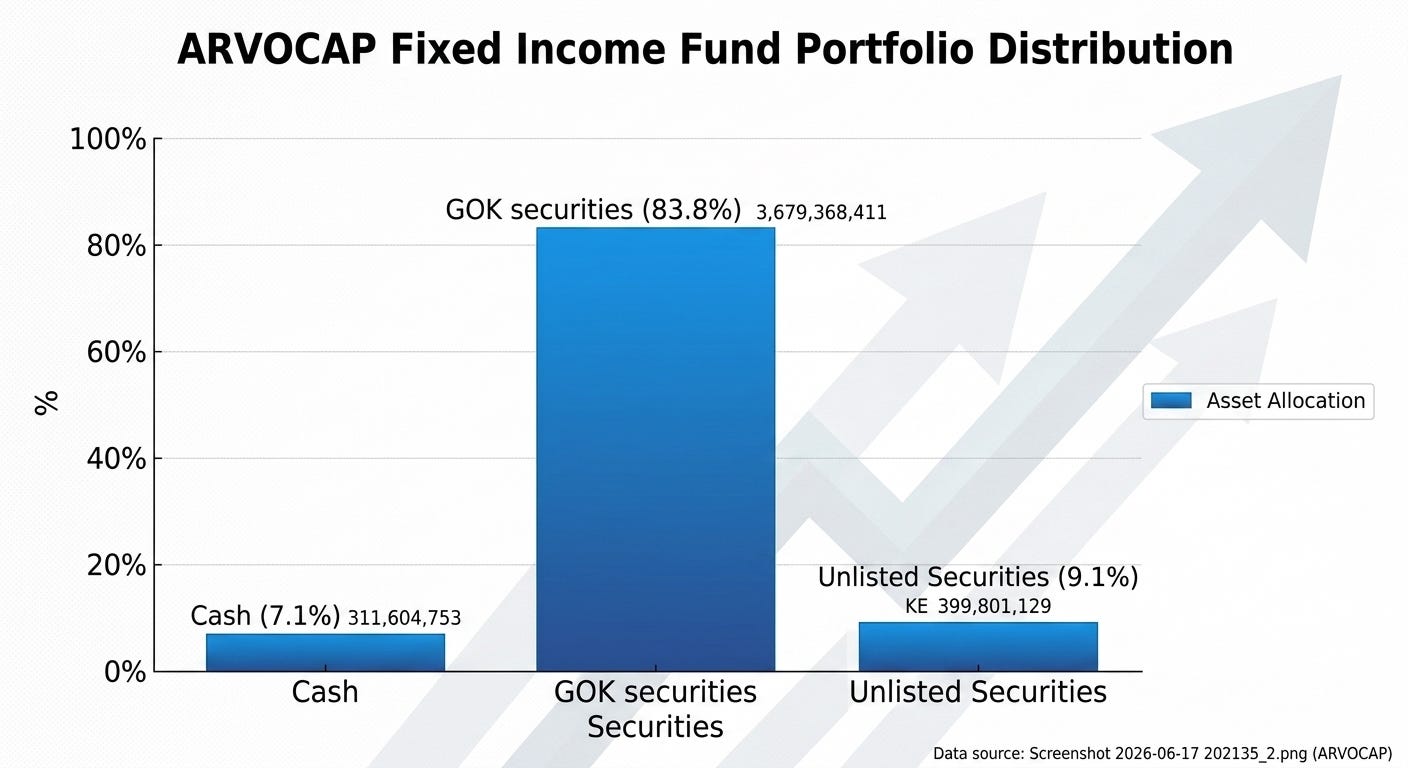
Fund-Specific Specialization: ARVOCAP categorizes its assets into highly focused mandates. While the Fixed Income fund follows a classic domestic strategy (dominantly GOK Securities at ~83.8%), the special funds (Multi-Asset, Africa Equity, Global Equity) emphasize capital appreciation through external markets.
Strategic Offshore Diversification: ARVOCAP is one of the few managers with significant cross-border exposure. The Arv Multi Asset fund (KES 1.025 billion in offshore) and Global Equity fund (KES 400.8 million in offshore) demonstrate a deliberate strategy to decouple from the Nairobi Securities Exchange (NSE) and Kenyan sovereign risk.
High Liquidity Management: A recurring strength across the portfolio is the maintenance of cash buffers. The total cash across the ARVOCAP suite is KES 1.73 billion, representing 16% of its total AUM. This suggests a cautious approach to operational liquidity, likely intended to manage the redemption risks inherent in their more specialized funds.
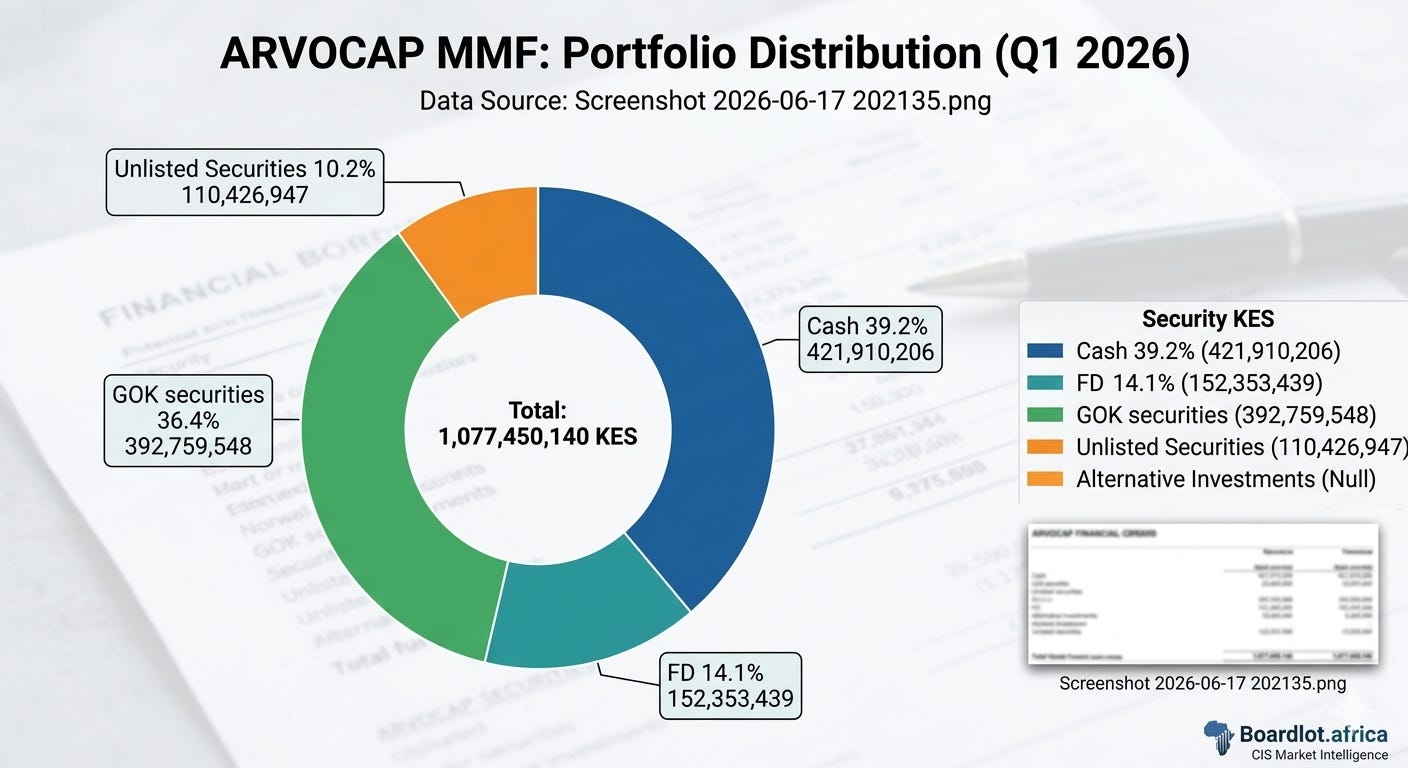
Strategic Anomalies & Risk Profile
The ‘Global Equity’ Fund Concentration: The Global Equity fund, with a total AUM of KES 444 million, has KES 400.8 million—or roughly 90%—allocated exclusively to Offshore investments. This is a very high concentration of offshore risk for a retail-facing CIS. While it provides international diversification, it leaves local investors almost entirely exposed to the volatility and performance of international equity markets, with negligible local underlying assets to hedge against currency fluctuations.
‘Africa Equity’ Strategy Divergence: The Africa Equity fund shows a hybrid approach with KES 297 million in Listed Securities and KES 341 million in Offshore assets. This split strategy is interesting, as it essentially bets on both regional (African) listed equities and broader international markets simultaneously. The anomaly here is the lack of a clear regional focus, as the offshore allocation may dilute the purported “Africa” mandate if a significant portion is invested in developed markets.
‘Ngao FI’ (Fixed Income) Concentration: The Ngao FI fund is almost entirely concentrated in GOK Securities (KES 407.5 million out of 487.6 million). This is a standard, low-risk approach, but in the context of a suite of funds otherwise focused on high-growth/global assets, it highlights a stark bifurcation in ARVOCAP’s product offering—creating a “barbell” risk profile where investors must choose between extremely conservative domestic income or highly exposed international equity.
Summary of Risk
ARVOCAP’s risk is primarily currency and geopolitical, rather than the liquidity risks seen in some peers. By leaning heavily into offshore assets, they have successfully avoided the “unlisted security” traps seen in other managers, but they have traded that risk for a high dependence on international market performance.
IV. ETICA Portfolio Strategy Analysis
Fixed-Income Centricity: The core of Etica’s strategy is heavily weighted toward Government of Kenya (GOK) securities and fixed deposits. For instance, the Fixed Income Fund holds approximately 75% of its value in GOK securities and fixed deposits combined, prioritizing stable yield over equity participation.
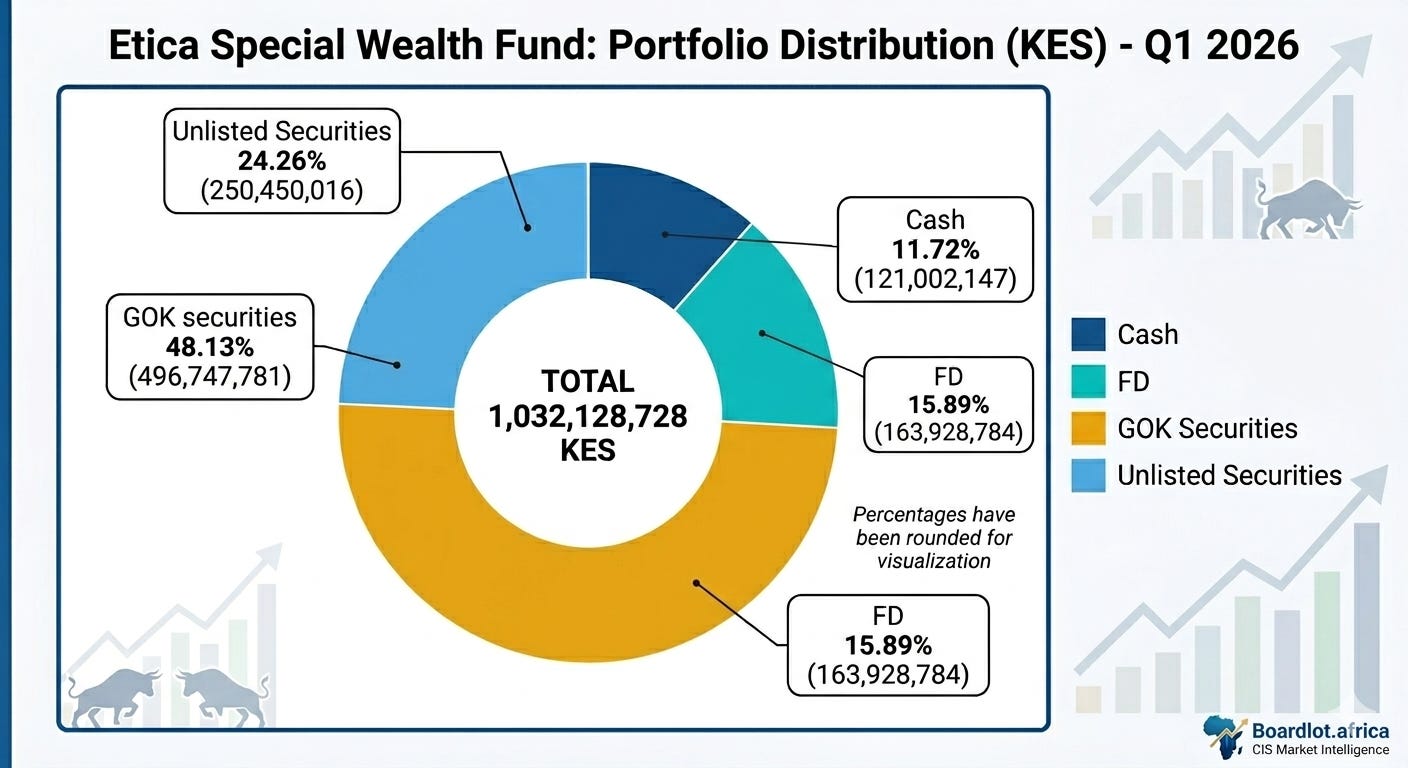
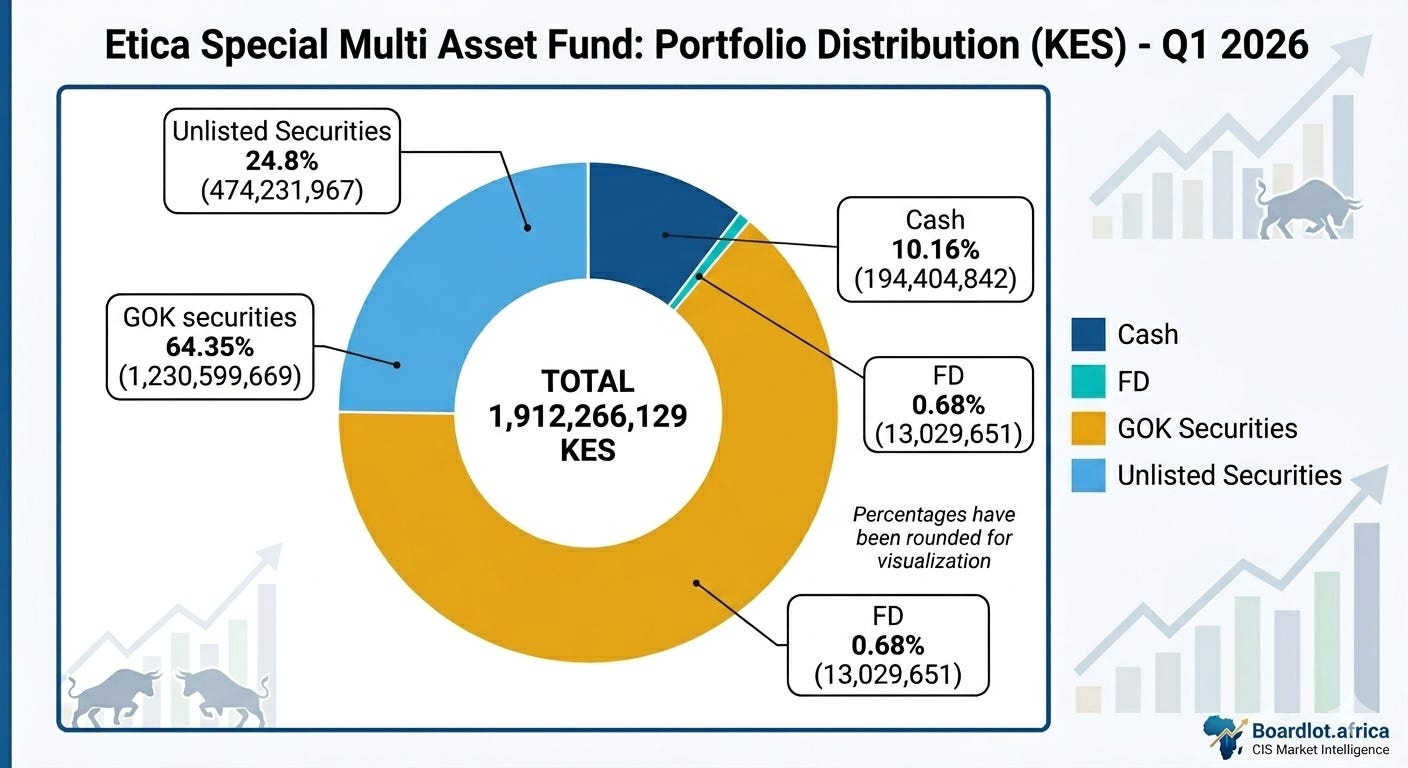
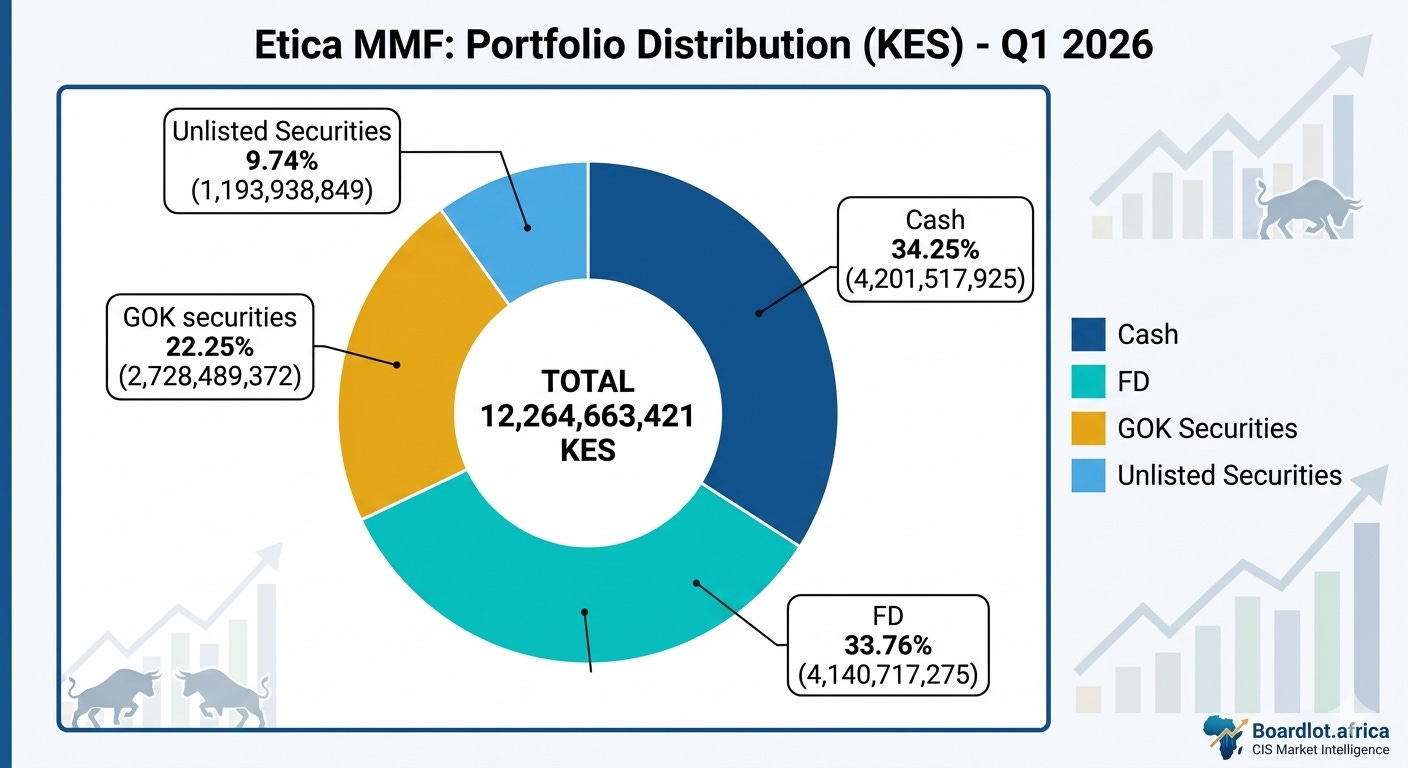
Active Liquidity Management: The Money Market Fund (MMF) demonstrates a more balanced approach, with significant allocations to both cash and fixed deposits, which is standard for maintaining liquidity for retail investors.
Specialized Yield Seeking: The Special Multi-Asset and Special Wealth funds show a shift toward higher-yielding, less traditional instruments, with significant portions of their portfolios allocated to Unlisted Securities—roughly 24.8% and 24.2% respectively
Likely Risks and Anomalies
Liquidity Risk in Special Funds: The significant allocation to Unlisted Securities within the Special Multi-Asset (KES 474.2 million) and Special Wealth (KES 250.4 million) funds presents a clear liquidity risk. These assets lack a secondary market, making them difficult to liquidate rapidly if there is a sudden surge in investor redemption requests.
Concentration Risk: The Etica portfolio shows limited diversification into listed equities or offshore assets across its suite of funds. By remaining almost entirely within domestic fixed-income and unlisted instruments, the funds are highly exposed to Kenya-specific sovereign risk and domestic economic volatility.
Valuation Transparency: The heavy reliance on Unlisted Securities across the firm’s special products poses valuation challenges. Unlike listed instruments, which provide daily market-based pricing, the valuation of unlisted assets is typically based on periodic appraisals, which may not accurately reflect real-time market conditions during periods of stress.
V. MADISON Portfolio Strategy Overview
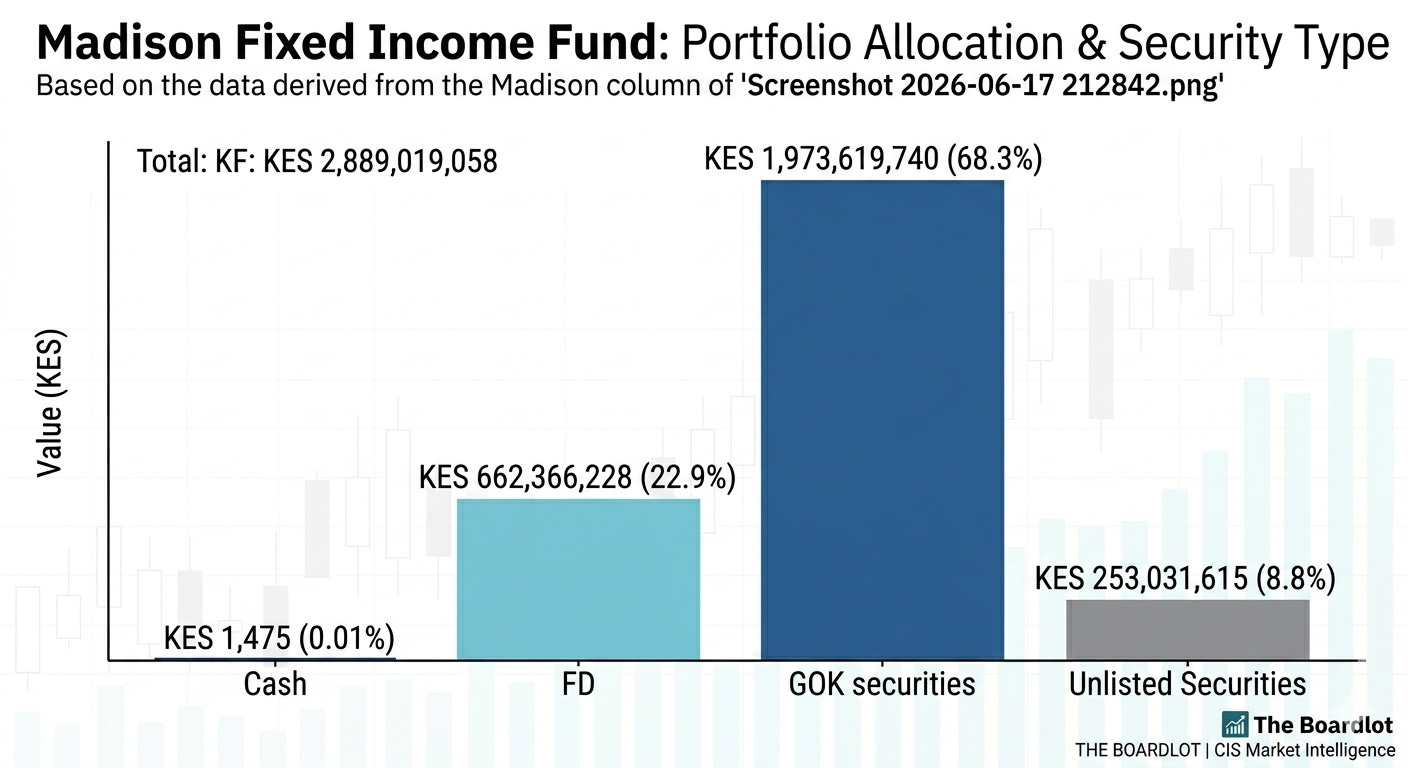
Fixed Income Fund: This fund is heavily skewed toward capital preservation through yield-bearing assets, with 68.3% of its KES 2.89 billion AUM invested in GOK Securities. The remaining significant portion is held in Fixed Deposits (22.9%), creating a conservative, domestic-focused risk profile with negligible cash on hand (KES 1,475).
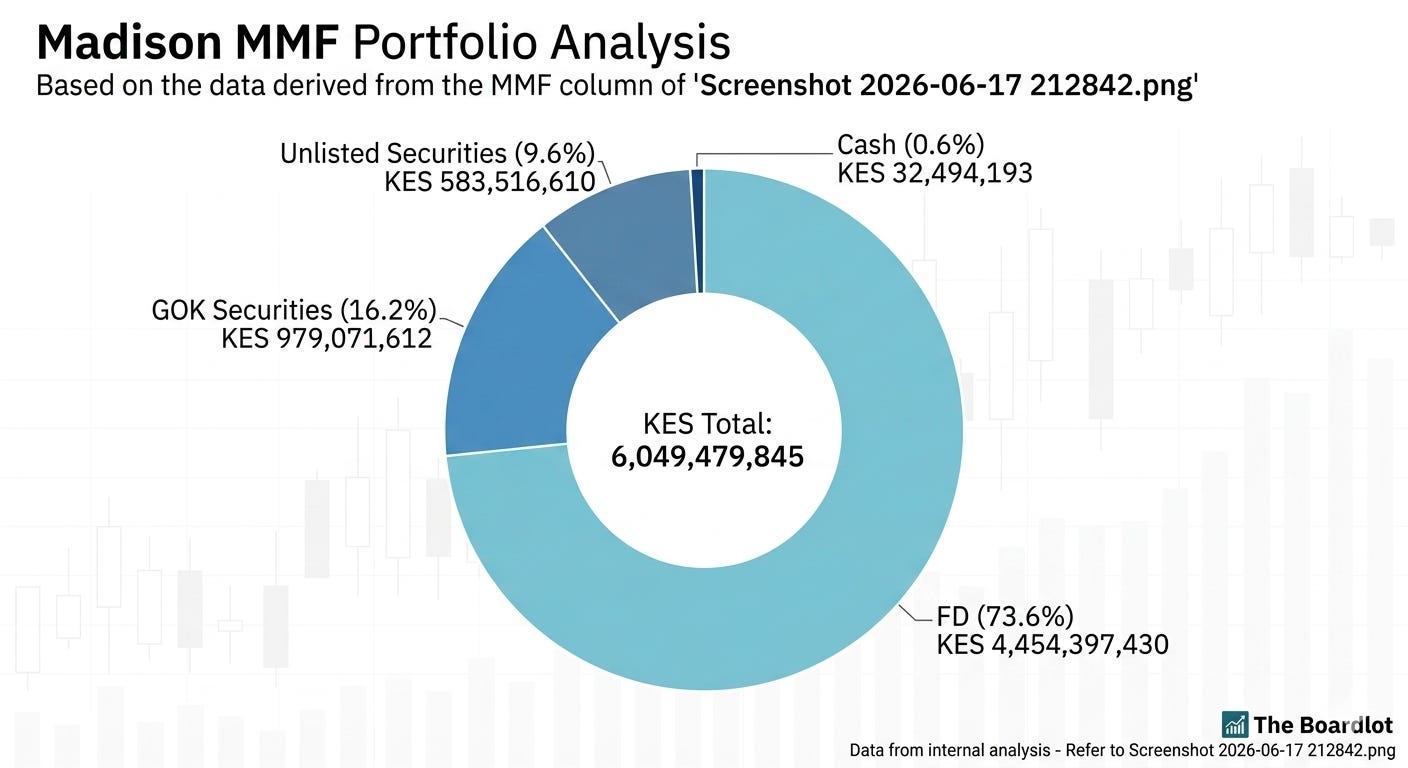
Money Market Fund (MMF): This vehicle is designed for liquidity but functions with a high concentration in Fixed Deposits (73.6%), totaling KES 4.45 billion. While it maintains standard MMF characteristics, it also includes a notable 9.6% allocation to Unlisted Securities, which is unusual for a typical retail liquidity fund.
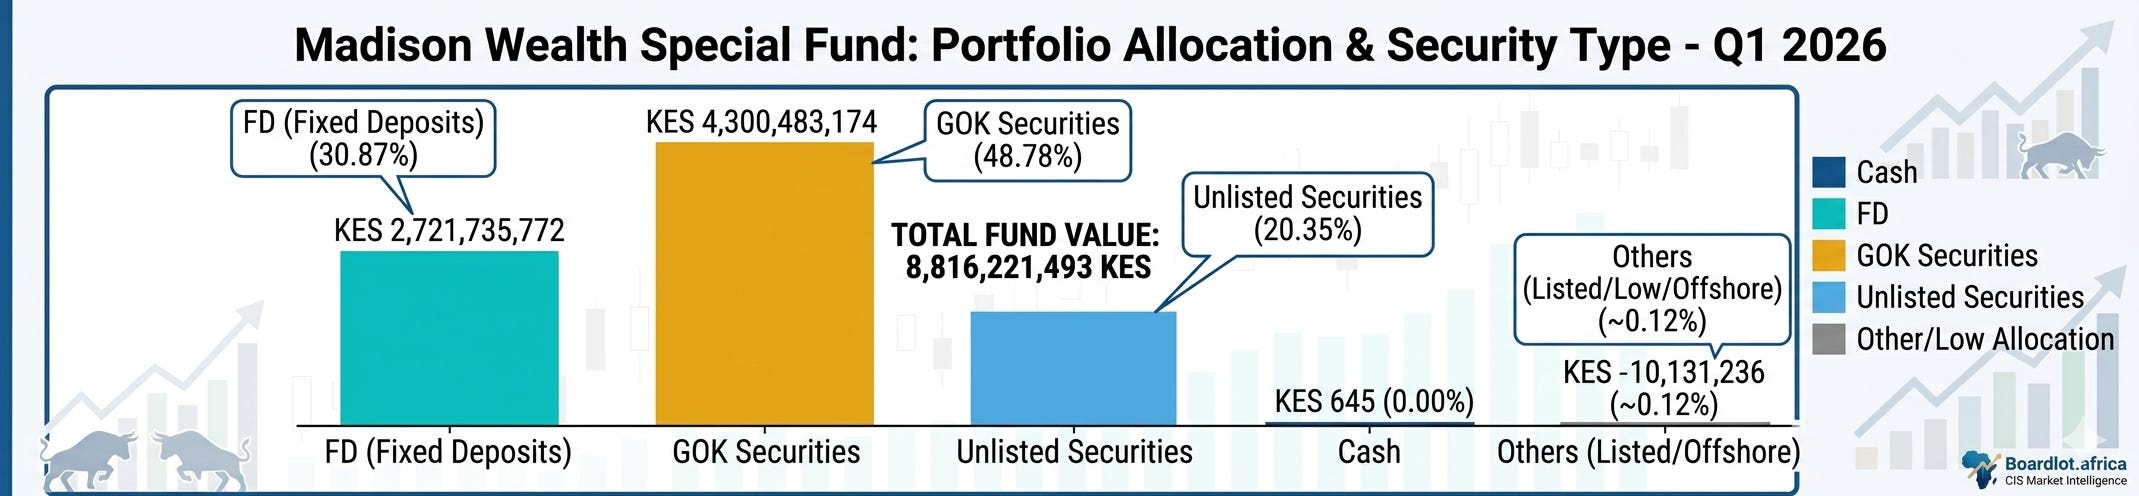
Wealth Special Fund: This fund employs a “fully invested” growth strategy, focusing on higher-yield, less liquid assets. Its portfolio is anchored by GOK Securities (48.8%) and Fixed Deposits (30.9%), with a significant 20.4% allocation to Unlisted Securities. Like the other funds, it maintains minimal cash reserves (KES 645).
Likely Strategic Risks
Operational Liquidity Risk: A major anomaly across Madison’s suite is the maintenance of virtually zero operational cash across all three funds—often in the range of KES 1,000 or less. This suggests a strategy of continuous reinvestment, which leaves the manager highly vulnerable to sudden liquidity shocks or large-scale redemption requests.
Valuation and Liquidity of Unlisted Assets: Across all three funds, Madison consistently allocates significant portions of capital (between 8.8% and 20.4%) into Unlisted Securities. These assets lack secondary market transparency and immediate liquidity, representing a major risk factor for funds that offer either retail or wealth-managed exit paths.
Concentration Risk: The funds remain almost entirely exposed to domestic Kenyan assets, specifically GOK securities and local bank deposits. There is no meaningful diversification into offshore markets, equities, or other alternative asset classes, leaving the portfolios entirely dependent on local economic and sovereign credit conditions.
6. The Scalability Challenge: Can Smaller Players Survive?
While the CIS industry continues to record aggregate growth, a significant segment of the market—comprised of twelve distinct unit trust schemes—is operating with Assets Under Management (AUM) of less than KES 1 billion each. Collectively, these twelve managers command a market share of only KES 2.19 billion, representing a mere 0.26% of the total industry market share as of March 2026.
The Economics of Small-Scale Management
The data reveals a precarious position for these funds, many of which are experiencing stagnation or decline. Below are the schemes operating with AUM under KES 1 billion as of March 2026:
Orient Unit Trust Scheme: KES 585,190,642 (-7% change)
Genghis Unit Trust Funds: KES 583,989,697 (-6% change)
Faulu Unit Trust Scheme: KES 299,449,525 (-2% change)
Taifa Unit Trust Scheme: KES 295,203,601 (1% change)
VCG Offshore Opportunities: KES 115,230,166
Ziidi Shariah Money Market Fund: KES 113,919,531 (67% change)
Equity Investment Bank: KES 105,262,726 (-4% change)
Kibaba Unit Trust Funds: KES 46,480,216
XENO Unit Trust Funds: KES 22,542,644 (-9% change)
Amana Unit Trust Funds: KES 21,265,300 (-27% change)
Wanafunzi Fixed Income Fund: KES 960,311 (2% change)
Jaza Unit Trust Fund: KES 44,106 (40% change)
The Break-Even Question
Operating a regulated fund management firm entails significant fixed costs, including licensing fees, regulatory compliance, reporting infrastructure, and personnel. Given that firms like Jaza Unit Trust Fund are operating with an AUM of only KES 44,106, and Wanafunzi Fixed Income Fund with KES 960,311, the industry is forced to confront a difficult question: Can these smaller players realistically break even?.
Without the economies of scale enjoyed by the top-tier managers who control over 63% of the market, these smaller entities face intense pressure. It remains to be seen whether these managers can secure sustainable growth trajectories or if the current competitive landscape will inevitably lead to industry consolidation through mergers and acquisitions of these smaller, sub-scale units.
What a gem of info 💎👍🙏