
The Personality Tax: When CEO Mandates Collide with Financial Realities
By Boardlot Africa Research
The H1 2026 reporting season for East Africa’s largest commercial lenders has drawn to a close, leaving behind a stark market reality. For investors on the Nairobi Securities Exchange (NSE), the macro story goes far beyond interest rate adjustments by the Central Bank of Kenya (CBK). The underlying driver of performance across East Africa’s top banking institutions is executive leadership style—and the operational friction that comes with it. Behind every line item in the balance sheet is a Chief Executive’s strategic vision. In an environment marked by domestic margin compression, shifting monetary policies, and volatile regional currencies, the financial sector has transformed into an arena where corporate personalities directly dictate earnings resiliency:
Paul Russo has leveraged his background to turn KCB Group into an operational debt-recovery engine.
Dr. James Mwangi’s personal drive continues to push Equity Group’s regional expansion and fee-income diversification.
Dr. Gideon Muriuki’s long-standing, quiet compounding strategy keeps Co-operative Bank of Kenya humming with steady efficiency.
Kenny Fihla’s attempt to execute a unified pan-African corporate mandate faces market friction at Absa Bank Kenya.
Here is Boardlot Africa’s detailed comparison of how these four corporate playbooks stacked up in H1 2026.
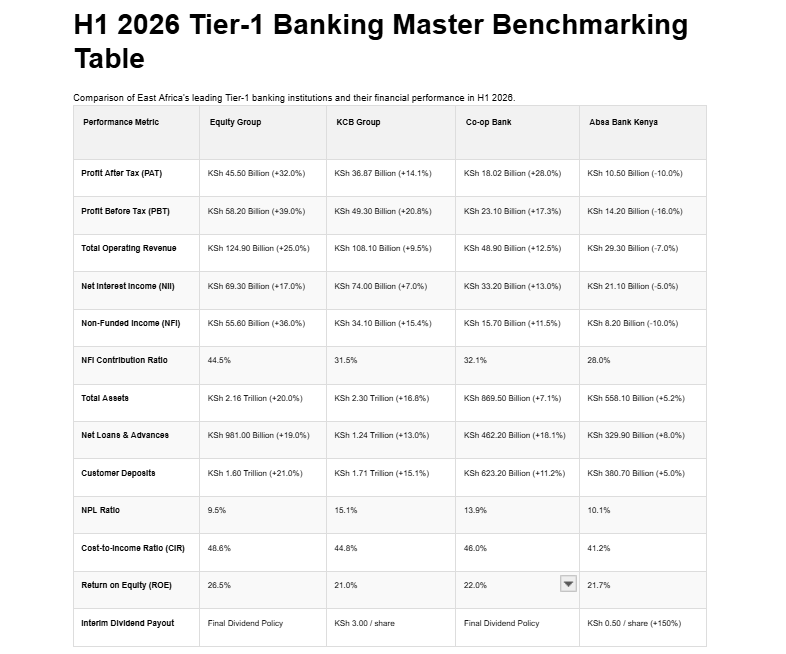
H1 2026 Tier-1 Benchmarking Breakdown
Profit After Tax (PAT):
Equity Group: KSh 45.50 Billion (+32.0%)
KCB Group: KSh 36.87 Billion (+14.1%)
Co-op Bank: KSh 18.02 Billion (+28.0%)
Absa Bank Kenya: KSh 10.50 Billion (-10.0%)
Profit Before Tax (PBT):
Equity Group: KSh 58.00 Billion (+39.0%)
KCB Group: KSh 49.30 Billion (+20.8%)
Co-op Bank: KSh 23.10 Billion (+17.3%)
Absa Bank Kenya: KSh 14.20 Billion (-16.0%)
Total Operating Revenue:
Equity Group: KSh 124.90 Billion (+25.0%)
KCB Group: KSh 108.10 Billion (+9.5%)
Co-op Bank: KSh 48.90 Billion (+12.5%)
Absa Bank Kenya: KSh 29.30 Billion (-7.0%)
Net Interest Income (NII):
Equity Group: KSh 69.30 Billion (+17.0%)
KCB Group: KSh 74.00 Billion (+7.0%)
Co-op Bank: KSh 33.20 Billion (+13.0%)
Absa Bank Kenya: KSh 21.10 Billion (-5.0%)
Non-Funded Income (NFI) & Contribution Ratio:
Equity Group: KSh 55.60 Billion (+36.0%) | 44.5% ratio
KCB Group: KSh 34.10 Billion (+15.4%) | 31.5% ratio
Co-op Bank: KSh 15.70 Billion (+11.5%) | 32.1% ratio
Absa Bank Kenya: KSh 8.20 Billion (-10.0%) | 28.0% ratio
Balance Sheet Scale (Total Assets & Customer Deposits):
Equity Group: Assets of KSh 2.16 Trillion (+20.0%) | Deposits of KSh 1.60 Trillion (+21.0%)
KCB Group: Assets of KSh 2.30 Trillion (+16.8%) | Deposits of KSh 1.71 Trillion (+15.1%)
Co-op Bank: Assets of KSh 869.50 Billion (+7.1%) | Deposits of KSh 623.20 Billion (+11.2%)
Absa Bank Kenya: Assets of KSh 558.10 Billion (+5.2%) | Deposits of KSh 380.70 Billion (+5.0%)
Asset Quality (NPL Ratio) & Efficiency (CIR):
Equity Group: NPL Ratio at 9.5% | Cost-to-Income Ratio at 48.6%
KCB Group: NPL Ratio at 15.1% | Cost-to-Income Ratio at 44.8%
Co-op Bank: NPL Ratio at 13.9% | Cost-to-Income Ratio at 46.0%
Absa Bank Kenya: NPL Ratio at 10.1% | Cost-to-Income Ratio at 41.2%
Return Metrics & Shareholder Payout Policy (ROE & Dividends):
Equity Group: ROE of 26.5% | No Interim Dividend (Annual Dividend Policy)
KCB Group: ROE of 21.1% | Interim Dividend of KSh 3.00 / share
Co-op Bank: ROE of 22.0% | Final Dividend Policy Only
Absa Bank Kenya: ROE of 21.7% | Interim Dividend of KSh 0.50 / share (+150%)
1. Paul Russo (KCB Group): The HR Specialist Turned Recovery Bulldozer
When Paul Russo stepped into the leadership role at KCB Group, skeptics wondered how an executive with deep roots in Human Resources and organizational transformation would handle balance sheet restructuring, legacy non-performing loan portfolios, and multi-country operational integration. Russo’s H1 2026 performance offers a decisive answer: he turned East Africa’s largest balance sheet into an aggressive debt-recovery engine. Russo’s operating bet is cultural and credit-led: align the group around collections, restructuring, provisioning discipline, and accountability. On a book this size, that is not a slogan. Gross NPLs fell to about KSh 203.8 billion. The group NPL ratio dropped 360 basis points year on year to 15.1% from 18.7%. IFRS and regulatory coverage both moved higher. Real estate, agriculture, and manufacturing drove most of the improvement. Hold the applause to one beat. 15.1% is still the worst NPL ratio of the four banks in this note. Equity’s group book is at 9.5%. Absa Kenya is at 10.1%. Co-op is at 13.9%. Russo turned KCB into a recovery engine. He has not yet turned it into the cleanest engine. The stock of stress is smaller. It is not small.
The Financial Outcome
Scale: KCB remained East Africa’s largest lender by assets at KSh 2.30 trillion (+16.8%) and deposits at KSh 1.71 trillion (+15.1%). The group still funds itself like a wholesale and relationship franchise, not a digital upstart.
Income: Total operating income rose 9.5% to KSh 108.10 billion. Net interest income grew a slower 7.0% to KSh 74.00 billion as the rate cycle caught the funded book. Non-funded income rose 15.4% to KSh 34.10 billion, 31.5% of revenue — useful diversification, still well short of Equity’s 44.5%.
Earnings and tax: Profit before tax rose 20.8% to KSh 49.30 billion. Profit after tax rose only 14.1% to KSh 36.87 billion. The gap is tax, not operating fade: the tax charge jumped about 46% to roughly KSh 12.5 billion. If you stop at PBT, Russo looks like he outran the cycle. If you stop at PAT, the state took a larger share of the cleanup.
Efficiency: Cost-to-income improved to the mid-44% range. Lower impairments helped the pre-tax line as much as cost control did.
Capital allocation: The board raised the interim dividend 50% to KSh 3.00 per share, a KSh 9.64 billion cash distribution. That is the tell. Management is confident enough in capital and collections to pay shareholders while the NPL ratio is still the peer-group laggard.
Russo’s H1 is therefore a dual statement. Execution on recoveries is visible in the NPL stock, coverage, and the decision to write a larger cheque to shareholders. The open item is whether the next legs come from a cleaner origination engine — not just a better workout unit — and whether 15.1% can move toward the single-digit quality Equity already prints at group level. Until that happens, KCB is the region’s biggest bank and its most improved stressed book, not its highest-quality one.
2. Dr. Gideon Muriuki (Co-op Bank): Quiet Compounding Discipline
Dr. Gideon Muriuki’s strategic playbook at Co-operative Bank of Kenya avoids market noise. Over more than two decades, Muriuki has built a model grounded in steady compounding, tight cost containment, operational discipline, and deep integration with Kenya’s cooperative movement. His management philosophy is anchored by the “Soaring Eagle” transformation agenda. Rather than committing heavy capital to high-risk foreign acquisitions, Muriuki has directed resources into expanding domestic market share across micro, small, and medium enterprises (MSMEs), agriculture value chains, and high-margin digital credit.
The Financial Outcome
High Net Profit Growth: Co-op Bank recorded a 28.0% jump in Net Profit to KSh 18.02 Billion, marking one of the strongest bottom-line growth rates among Kenya-centric Tier-1 banks in H1 2026.
Digital Loan Execution: MCo-op Cash and digital E-Credit platforms disbursed KSh 40.4 Billion in H1 alone, lifting total digital disbursements past KSh 561 Billion without incurring brick-and-mortar overhead costs.
Operational Control: Even with ongoing economic headwinds in the domestic market, Co-op Bank held its Cost-to-Income Ratio to 46.0%, delivering an impressive 23.5% Return on Equity.
Muriuki’s steady leadership proves that focused domestic execution and sticky cooperative deposit funding can consistently generate top-tier returns.
3. Dr. James Mwangi (Equity Group): Relentless Expansion and NFI Diversification
Gideon Muriuki compounds inside Kenya. James Mwangi compounds across borders and across the income statement. H1 2026 is the cleanest recent proof that those two choices now show up in the mix, not just in the rhetoric. Equity is no longer a Kenyan retail bank with a few foreign branches. Regional subsidiaries now hold more than half of banking assets, about 54% of the loan book and 51% of deposits. Kenya is still the largest single profit engine — pre-tax profit there rose about 35% to KSh 29.4 billion — but it is no longer the whole story. That is why a CBK rate cut hurt Equity less than it hurt a Kenya-only book. The second hedge is non-funded income. Trade finance, payments, merchant acquiring, and FX lifted NFI 36% to KSh 55.60 billion. NFI is now 44.5% of total income, up from about 40.8% a year earlier. When net interest margins compress, Equity has a fee machine. Most peers still do not.Fix the Congo line. Equity BCDC is important. It is not 38% of group earnings. Profit after tax at the DRC unit rose about 30% to KSh 11.8 billion. Regional subsidiaries as a block contributed roughly 42% of banking profitability and 47% of revenue. Tanzania grew fastest off a smaller base, with PAT up about 82% to KSh 2.0 billion. The strategy is a portfolio of markets, not a single Congo bet.The Financial Outcome
Earnings: Net profit rose 32% to KSh 45.50 billion. Profit before tax rose 39% to about KSh 57.8 billion on total operating income of KSh 124.90 billion (+25%). Equity remains the earnings leader among the four, even though KCB is still larger by assets.
Funded book: Net interest income grew 17% to KSh 69.30 billion. Net loans rose 19% to KSh 981 billion. Deposits rose 21% to about KSh 1.59 trillion. Assets reached KSh 2.16 trillion (+20%).
Quality is a group number and a Kenya number. Group NPL fell to 9.5% from 13.7%. That is the best headline ratio in this set. It is also an average. Kenya’s NPL ratio was still about 15.1%. DRC was about 4.9%. Corporate NPLs almost halved. The quality win is real, and it is geographically uneven. Investors who stop at 9.5% are reading the consolidation, not the home market.
Efficiency and returns: Cost-to-income improved to about 48.6% from 51.7%, not the 42.1% some peer tables imply. Return on equity printed about 26.5%. Both are strong. Neither makes Equity the leanest operator in the set — Absa Kenya’s CIR is still lower, even after it deteriorated.
Dividend policy: No interim dividend. That is not a snub. Shareholders already approved a larger annual payout earlier in 2026, about KSh 21.7 billion or KSh 5.75 a share. H1 cash stayed in the group to fund regional expansion and the insurance build-out. Retention here is a growth choice, not a capital-stress choice.
Mwangi’s half is the case that strategy is visible in composition: more fees, more countries, a group NPL ratio pulled down by Central Africa, and a Kenyan book that still looks more like KCB than like BCDC. The open question is whether Kenya asset quality can follow the group ratio down without starving the expansion that made the group ratio possible.est income can protect earnings performance during local macroeconomic shifts.
4. Kenny Fihla (Absa Group): Corporate Mandates vs. Domestic Market Realities
Absa Bank Kenya’s H1 2026 story is a Kenya P&L story, not a Johannesburg org-chart story. Kenny Fihla is Group CEO of Absa Group. The Kenyan listing was run through the half by outgoing MD and CEO Abdi Mohamed, who stepped down on 30 June 2026 after three years in the role. Results were presented by Yusuf Omari, then interim MD and CEO and previously long-serving CFO. Omari was confirmed as MD and CEO on 10 September 2026. That distinction matters. Group CIB and pan-African priorities sit in the background. The H1 print was produced by a Kenya-only balance sheet, a corporate-heavy loan mix, and a local management team navigating CBK easing, softer FX income, and a leadership transition in the same reporting window.
Absa Kenya still has one of the cleaner books among listed peers and a strong capital buffer. What it does not have is Equity’s or KCB’s multi-country earnings hedge. When domestic yields compressed, there was no DRC or Tanzania subsidiary to offset the Kenyan rate cut.
The Financial Outcome
Revenue compression: Total operating income slipped 7.0% YoY to KSh 29.30 billion. Net interest income fell 5.0% to KSh 21.10 billion as the loan book re-priced lower. Non-funded income dropped 10.0% to KSh 8.20 billion, mainly on weaker FX and rates-related income rather than a collapse in the core franchise.
Earnings: Profit after tax fell 10.0% to KSh 10.50 billion. Profit before tax contracted 16.0% to KSh 14.20 billion.
Balance sheet: Customer assets still grew 8% to KSh 329.9 billion. Deposits rose 5% to KSh 380.70 billion, with transactional balances up 18%. Cost of funds fell about 90 basis points to 2.8%, and CASA stayed high at roughly 75% of deposits. The funding franchise held; the yield on assets did not.
Asset quality and efficiency: The NPL ratio improved to 10.1% from 13.0%, against an industry print near 14.6%. Coverage rose to 69%. Impairments eased 4%. The cost-to-income ratio, however, moved the wrong way for a “efficiency champion” headline: 41.2%, up from 36.4%, as the bank spent on talent and technology. The 41.2% figure is still tight versus peers. The direction of travel is the point.
Capital and payout: Total capital adequacy stood at 19.4%, with core capital around 17.4%. Management raised the interim dividend 150% to KSh 0.50 per share. That is a local capital-allocation choice: earnings down, cash returned up, balance sheet still thick enough to fund it.
The better reading is not that a group CIB mandate “failed in Kenya.” It is that Mohamed’s last half and Omari’s first weeks as standing CEO met a rate-cut cycle with a Kenya-centric, wholesale-tilted book. Credit quality and funding costs were managed well. Top-line mix was not diversified enough to protect earnings. For investors, the question from here is whether Omari uses the CFO’s grip on funding, capital, and costs to rebuild NFI and loan growth—without giving back the asset-quality advantage Absa Kenya already has.
Strategic Takeaways for Investors
The H1 2026 results confirm that leadership strategy directly influences balance sheet outcomes in East Africa’s banking sector:
Executive Focus Drives Performance: Paul Russo’s recovery efforts, James Mwangi’s regional scale, Gideon Muriuki’s cost control, and Kenny Fihla’s corporate realignment each left a clear mark on H1 financial results.
Revenue Mix Provides Stability: Lenders generating over 40% of their revenue from non-funded sources navigated interest rate cycles far better than those reliant solely on interest spreads.
Cross-Border Footprints Add Flexibility: Multi-subsidiary models—particularly those operating in high-growth markets like the DRC—offered a useful hedge against domestic margin pressure.
As central banks across the region adjust monetary policy, operational discipline, credit quality management, and leadership execution will remain the key drivers of long-term shareholder value.
About Boardlot Africa Research
Boardlot Africa is a premier financial intelligence and corporate governance publication dedicated to unpacking the mechanics of capital, market strategies, and structural shifts across East Africa’s corporate landscape. By bridging the gap between raw economic data and actionable market intelligence, we deliver deep-dive research, independent corporate analysis, and policy insights designed for institutional investors, boardrooms, and sharp market observers.
Get in Touch
Email: boardlot.research@gmail.com
Phone: +254 753 133 901
Substack: Subscribe to Boardlot Africa
X (Twitter): BoardLotSultan
Wall Street sees 9.5% NPLs at Equity and buys the story, ignoring that their home market in Kenya is hit just as hard as KCB’s, meanwhile Absa gets crushed by local rate cuts.