
The Microfinance Illusion: Why Kenya’s MFI Sector is a Capital Trap for Investors
Part 1: Executive Summary & The Investment Thesis
The Bottom Line Up Front (BLUF)
While Kenya’s Tier 1 commercial banks bask in record asset expansions and billions in pre-tax profits, the Microfinance Bank (MFB) subsector is caught in a multi-year structural death spiral. For private equity players, institutional allocators, and retail investors hunting for yield, microfinance banking in its current legal and operational format is fundamentally unviable as an asset class.
The Diagnostic Reality
A forensic review of recent sector performance data—including data from the Central Bank of Kenya’s supervisory reports and market analyses—paints a grim picture:
The Divergence: While the wider banking sector expanded net assets by 10.3% to Ksh 8.35 trillion and customer deposits surged 11.6% to Ksh 6.12 trillion, MFBs remain structurally stagnant and undercapitalized.
The Structural Squeeze: Microfinance banks saw their deposit growth crawl sluggishly to roughly Ksh 45.1 billion system-wide—a rounding error in a multi-trillion-shilling financial ecosystem dominated by mega-lenders.
Chronic Unprofitability: The subsector continues to hemorrhage capital through multi-year cumulative losses, rising non-performing loans (NPLs), and debilitating compliance overheads.
The Core Investment Thesis
The traditional microfinance model—built on high-touch, high-cost physical branch networks, manual group-lending methodologies, and expensive short-term local deposits—has been structurally broken. Caught in a vicious crossfire between agile digital credit providers (DCPs) and aggressive Tier 1 commercial banks scaling downmarket via automated APIs, MFBs have lost their competitive moat.
Throwing fresh equity or subordinated debt into sub-scale microfinance banks is no longer a rescue mission; it is a capital trap.
Part 2: Forensic Anatomy of a Shrinking Sector
To understand why the Microfinance Bank (MFB) subsector represents an acute capital trap, one must look past the aggregate growth of Kenya’s broader financial ecosystem and examine the exact balance sheet numbers extracted from the Central Bank of Kenya’s Supervisory Annual Report. While mainstream commercial banks scale past historical milestones, microfinance asset trajectories reveal structural vulnerability and deep polarization.
Microfinance Banks: Comparative Asset and Performance Matrix
The table below details individual Microfinance Bank classifications, asset movements, and calculated year-on-year growth between December 2024 and December 2025 (figures in millions of KES where applicable):
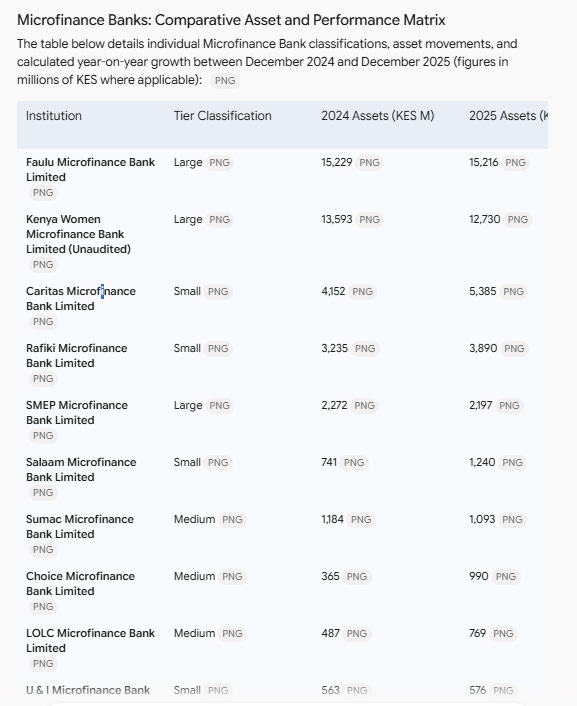
Source: Financial Statements (December 2024 and December 2025) via Central Bank of Kenya Bank Supervision Annual Report 2025.
1. The Marginal Scale of the MFB Sector
The numbers lay bare the extreme macro irrelevance of microfinance banks in Kenya:
A Drop in the Ocean: While the total banking sector commands over Ksh 6.16 trillion in assets, the entire MFB subsector accounts for a paltry Ksh 45.1 billion—roughly 0.73% of total banking assets.
Stagnant Giants: The largest legacy players in the space (such as Faulu and Kenya Women MFB) actually contracted year-on-year, proving that even historical scale is failing to capture organic market growth or withstand competitive pressures.
2. The Illusion of Aggregate Growth
While the sub-total shows a nominal asset increase of about Ksh 2.27 billion (moving from Ksh 42.8B to Ksh 45.1B, representing a modest 5.30% growth compared to the broader banking sector’s 11.60%), this expansion is heavily skewed. It is driven by localized capital injections or aggressive balance sheet shifts in a few smaller or medium institutions (such as Choice, Umba, and Salaam MFB), masking the deep-seated contraction occurring across the rest of the subsector.
Investment Reality
A subsector whose total combined assets cannot match a single mid-tier commercial bank, coupled with high baseline operating costs and severe asset polarization, offers no structural safety for investor capital.
Part 3: Chronically Red: The Multi-Year Profitability Black Hole
While a stagnant asset base illustrates the lack of structural growth, the income statements of Kenya’s Microfinance Banks (MFBs) reveal an even more alarming reality: chronic, multi-year unprofitability that devours shareholder capital.
Microfinance Banks: Profit & Loss Breakdown (December 2025)
(Figures in Millions of KES)
KWFT
Total Income: Ksh 1,628M | Total Expenses: Ksh 3,603M
Operating Profit/(Loss): (Ksh 1,975M) | Pre-Tax Profit/(Loss): (Ksh 2,145M) | Net Profit/(Loss) After Tax: (Ksh 2,192M)
Faulu
Total Income: Ksh 3,177M | Total Expenses: Ksh 3,491M
Operating Profit/(Loss): (Ksh 314M) | Pre-Tax Profit/(Loss): (Ksh 387M) | Net Profit/(Loss) After Tax: (Ksh 387M)
Rafiki
Total Income: Ksh 862M | Total Expenses: Ksh 908M
Operating Profit/(Loss): (Ksh 46M) | Pre-Tax Profit/(Loss): (Ksh 147M) | Net Profit/(Loss) After Tax: (Ksh 147M)
SMEP
Total Income: Ksh 726M | Total Expenses: Ksh 924M
Operating Profit/(Loss): (Ksh 198M) | Pre-Tax Profit/(Loss): (Ksh 258M) | Net Profit/(Loss) After Tax: (Ksh 270M)
Caritas
Total Income: Ksh 932M | Total Expenses: Ksh 861M
Operating Profit/(Loss): Ksh 71M | Pre-Tax Profit/(Loss): Ksh 69M | Net Profit/(Loss) After Tax: Ksh 69M
Sumac
Total Income: Ksh 516M | Total Expenses: Ksh 341M
Operating Profit/(Loss): Ksh 175M | Pre-Tax Profit/(Loss): Ksh 5M | Net Profit/(Loss) After Tax: Ksh 4M
LOLC
Total Income: Ksh 262M | Total Expenses: Ksh 229M
Operating Profit/(Loss): Ksh 33M | Pre-Tax Profit/(Loss): (Ksh 6M) | Net Profit/(Loss) After Tax: (Ksh 6M)
U & I
Total Income: Ksh 420M | Total Expenses: Ksh 246M
Operating Profit/(Loss): Ksh 175M | Pre-Tax Profit/(Loss): Ksh 96M | Net Profit/(Loss) After Tax: Ksh 67M
Salaam
Total Income: Ksh 170M | Total Expenses: Ksh 294M
Operating Profit/(Loss): (Ksh 124M) | Pre-Tax Profit/(Loss): (Ksh 124M) | Net Profit/(Loss) After Tax: (Ksh 88M)
Umba
Total Income: Ksh 94M | Total Expenses: Ksh 111M
Operating Profit/(Loss): (Ksh 17M) | Pre-Tax Profit/(Loss): (Ksh 17M) | Net Profit/(Loss) After Tax: (Ksh 17M)
On It
Total Income: Ksh 72M | Total Expenses: Ksh 220M
Operating Profit/(Loss): (Ksh 149M) | Pre-Tax Profit/(Loss): (Ksh 149M) | Net Profit/(Loss) After Tax: (Ksh 192M)
Branch
Total Income: Ksh 1,064M | Total Expenses: Ksh 965M
Operating Profit/(Loss): Ksh 100M | Pre-Tax Profit/(Loss): Ksh 100M | Net Profit/(Loss) After Tax: Ksh 65M
Muungano
Total Income: Ksh 136M | Total Expenses: Ksh 122M
Operating Profit/(Loss): Ksh 14M | Pre-Tax Profit/(Loss): Ksh 4M | Net Profit/(Loss) After Tax: Ksh 2M
Choice
Total Income: Ksh 233M | Total Expenses: Ksh 192M
Operating Profit/(Loss): Ksh 41M | Pre-Tax Profit/(Loss): Ksh 41M | Net Profit/(Loss) After Tax: Ksh 42M
Total MFB Sector
Total Income: Ksh 10,293M | Total Expenses: Ksh 12,507M
Operating Profit/(Loss): (Ksh 2,214M) | Pre-Tax Profit/(Loss): (Ksh 2,916M) | Net Profit/(Loss) After Tax: (Ksh 3,057M)
Source: MFBs Published Financial Statements via Central Bank of Kenya Bank Supervision Annual Report 2025.
1. The Multi-Year Profitability Black Hole
The income statement totals expose the deep structural distress across the sector:
Massive Net Losses: The combined MFB subsector recorded an aggregate net loss after tax of Ksh 3.057 billion for the period. Operating expenses (Ksh 12.507 billion) heavily overwhelmed total generated incomes (Ksh 10.293 billion).
The Concentration of Distress: Heavyweights like KWFT and Faulu posted massive operating losses of Ksh 1.975 billion and Ksh 314 million respectively, dragging down the entire subsector.
2. Capital Attrition and Impaired Equity
Continuous operating losses do not just disappear; they are absorbed directly by the balance sheet, eating away at core capital.
Severe Bottom-Line Bleeding: Out of the 14 microfinance banks surveyed, a significant portion remained deep in the red, with net after-tax figures signaling an inability to cover overhead.
The Shareholder Dilution Cycle: To prevent statutory intervention, existing investors face repeated, highly dilutive rescue capital injections. Pumping fresh equity into these entities functions less like an investment and more like a cash subsidy to plug perpetual operational holes.
3. The Myth of the Turnaround Play
Many naive investors approach distressed MFBs under the illusion of a classic turnaround play—believing that a leaner digital strategy or a fresh executive team can pivot the balance sheet.
Negative Equity Realities: In practice, by the time an MFB reaches severe distress, its hidden non-performing loans and provisions far outweigh its tangible assets.
Value Destruction: Buying into a sub-scale MFI hoping for a miraculous operational turnaround ignores the systemic headwinds. Without the low-cost deposit mobilization of commercial banks or the scale of digital lenders, higher revenues remain mathematically out of reach.
Investment Takeaway
An asset class defined by perpetual bottom-line losses and mandatory capital bailouts is not an investment; it is a liability. Institutional allocators must recognize that the MFB profit model is structurally broken beyond easy repair.
Part 4: The Squeeze from All Sides (Structural Compression)
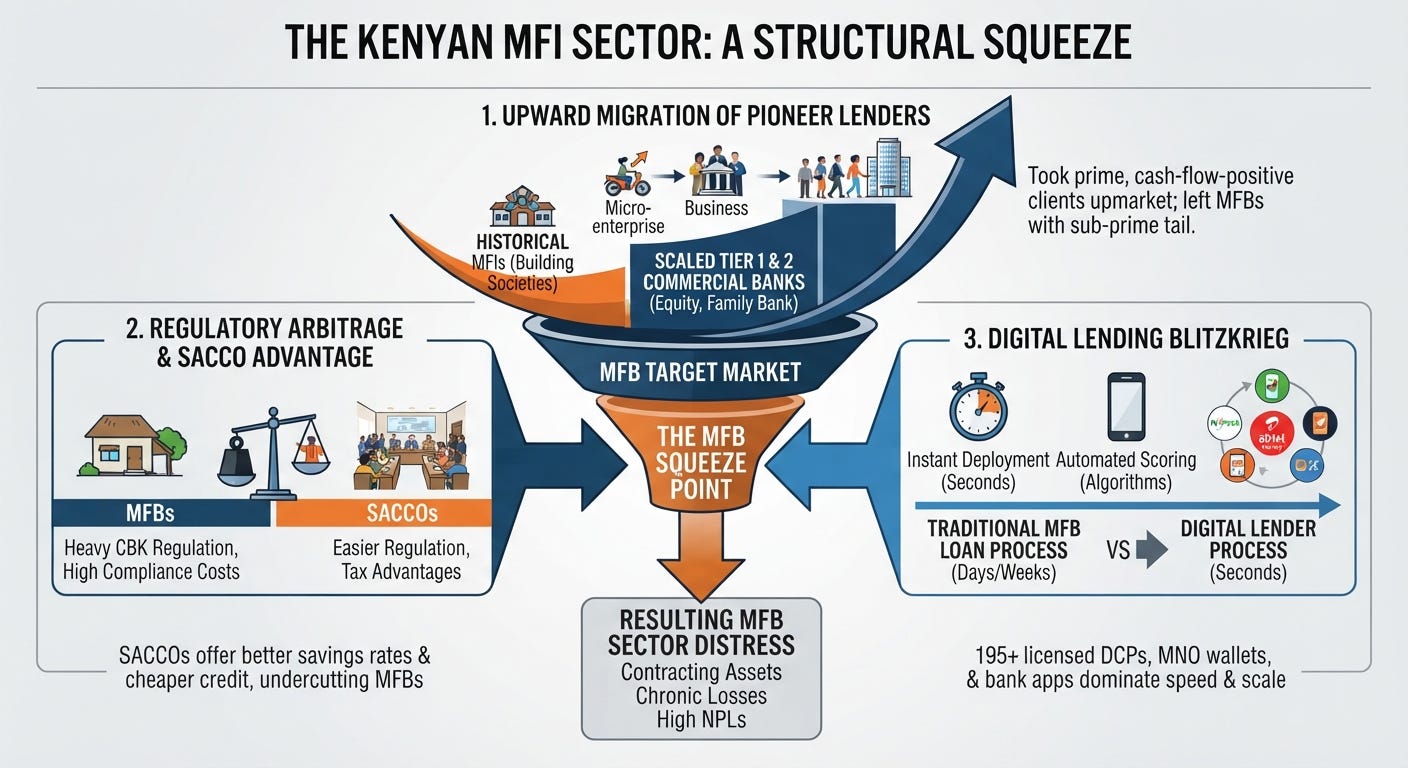
The structural unviability of Kenya’s Microfinance Bank (MFB) subsector is not the result of bad luck; it is the direct outcome of a brutal, multi-pronged competitive squeeze. MFBs are trapped in a shrinking middle, caught between historical giant killers, lightly regulated alternative lenders, and hyper-fast digital platforms.
1. The Upward Migration of Pioneer Lenders
The blueprint for serving the unbanked in Kenya was originally written by institutions like Equity Bank and Family Bank. Starting out as building societies and micro-focused entities (with Equity transitioning to a commercial bank in 2004 and Family Bank following suit in 2007), these institutions successfully utilized microfinance principles to build massive customer bases.
The Abandonment of the Base: Crucially, when these giants scaled, they moved upmarket with their customers. Rather than leaving a stable micro-tier behind, they upgraded their infrastructure, expanded their balance sheets, and brought millions of micro-borrowers into mainstream commercial banking.
The Result: Modern stand-alone MFBs were left fighting over an increasingly depleted, sub-prime segment, having missed out on the structural migration of cash-flow-positive retail clients.
2. The Regulatory Arbitrage of SACCOs
While MFBs labor under the heavy, costly compliance framework of the Central Bank of Kenya (requiring rigid core capital floors, expensive liquidity buffers, and exhaustive reporting), they face relentless competition from Savings and Credit Co-operatives (SACCOs).
SACCOs enjoy a much lighter regulatory touch and cooperative tax advantages.
This allows SACCOs to offer highly competitive dividend yields on savings and cheaper credit to salaried and agricultural groups, systematically undercutting MFBs on both sides of the balance sheet.
3. The Digital Blitzkrieg of Mobile Lenders
The final and most lethal blow comes from the tech frontier. With 195 licensed Digital Credit Providers (DCPs) operating alongside mobile network operator (MNO) wallets and commercial bank app-lenders, borrowers no longer need physical MFB branches or tedious group-guarantee meetings.
Speed to Disburse: Digital lenders can analyze data and deploy unsecured micro-loans in a matter of seconds via automated scoring algorithms.
Operational Agility: Unburdened by expensive brick-and-mortar branch networks, digital credit platforms can absorb higher default rates through massive volume scale—a luxury that capital-starved MFBs, struggling with high non-performing loans (NPLs), simply do not possess.
Investment Takeaway
MFBs are essentially an obsolete middle layer. They cannot match the low cost of capital and tech infrastructure of Tier 1 commercial banks, they cannot beat the regulatory freedom and community loyalty of SACCOs, and they cannot match the lightning speed of digital lenders.
Part 5: Asset Quality, Capital Erosion, and the NPL Quagmire
Beyond shrinking balance sheets and chronic bottom-line bleeding, the final structural barrier making Kenya’s Microfinance Bank (MFB) sector a glaring capital trap is its toxic asset quality and the resulting collapse of regulatory capital buffers. While Tier 1 commercial banks navigated 2025 by improving asset quality—bringing the broader sector’s gross NPL-to-gross-loans ratio down from 17.1% to 16.0% and holding a resilient capital adequacy ratio of 20.7%—microfinance institutions remain trapped in a high-risk default loop.
1. Severe Capital and Solvency Erosion
The compounding weight of non-performing loans and persistent operating losses has severely compromised the capital base of the microfinance subsector:
Collapsing Capital Ratios: According to the Central Bank of Kenya’s Bank Supervision Annual Report, the MFB sector’s core-capital-to-total-risk-weighted-assets ratio plummeted to a precarious 0.1% in 2025 (down from 6.0% in 2024), while the total-capital-to-total-risk-weighted-assets ratio dropped to 1.1% (down from 7.0%).
Breaching Statutory Floors: Both ratios fall drastically below the statutory minimum requirements of 10% and 12% respectively, with five microfinance banks failing to meet basic capital adequacy standards.
Shareholder Return Destruction: While a reduction in operating expenses helped narrow the sector’s aggregate pre-tax losses to KSh 2.9 billion, the return on shareholders’ funds deteriorated sharply, collapsing from negative 78.2% in 2024 to an alarming negative 168.2% in 2025.
2. The Sticky Portfolio at Risk (PAR)
Microfinance lending has historically relied on high-touch, group-guarantee models or unsecured small-business advances. In an economic environment marked by tight liquidity and inflationary pressures, these unsecured portfolios deteriorate rapidly.
The Delinquency Spiral: Unlike corporate loans backed by hard commercial collateral, MFB loan books consist largely of fragile micro-enterprises and salary-dependent retail borrowers who are highly vulnerable to macro shocks.
Aggressive Provisions: Heavy provisions for loan impairment continue to drain what little operational revenue MFBs manage to scrape together, turning potential gross earnings into net write-offs.
3. The Collateral Paradox
The traditional recovery mechanism for non-performing loans—seizing and liquidating borrower collateral—fundamentally fails in the microfinance space:
Worthless Guarantees: Group-guarantee systems collapse entirely when an entire local economic cluster faces synchronized hardship, as no member has the liquidity to bail out another.
High Legal & Recovery Costs: For small-ticket loans ranging from tens of thousands to a few hundred thousand shillings, the legal, administrative, and auctioneer costs of pursuing defaulters often exceed the actual recovery value of the collateral. Throwing good money after bad legal fees only deepens the insolvency of the institution.
4. MFB Asset Quality Spectrum: From Bad to Worse
To evaluate how individual institutions distribute across this risk spectrum, microfinance banks can be categorized based on their portfolio health, provisioning intensity, and capital attrition:
Here is the MFB Asset Quality Spectrum :
Bad (Manageable / Buffers Present)
Institutions: Caritas MFB, Sumac MFB, U & I MFB, and Choice MFB.
Asset & Portfolio Condition: These institutions manage to post modest positive net profits and maintain a degree of operating efficiency that absorbs baseline portfolio defaults without collapsing into terminal negative equity.
Structural Implication: While still exposed to micro-lending volatility, their core operations generate sufficient income to cover provisions, keeping them clear of immediate systemic rescue thresholds.
Worse (High Strain / Capital Erosion)
Institutions: Rafiki MFB, SMEP MFB, LOLC MFB, Branch MFB, Muungano MFB, Salaam MFB, and Umba MFB.
Asset & Portfolio Condition: Characterized by shrinking loan books or sticky delinquency rates that exhaust operational revenue, with many in this tier reporting bottom-line losses (e.g., SMEP’s net loss of KSh 270M and Rafiki’s KSh 147M).
Structural Implication: Heavy loan impairment provisions regularly wipe out interest income, forcing reliance on parent-company support or external bailouts to stay compliant with regulatory minimums.
Worst (Terminal / Severe Insolvency Risk)
Institutions: KWFT MFB, Faulu MFB, and On It MFB.
Asset & Portfolio Condition: Representing the heaviest concentration of distress in the sector, with KWFT and Faulu alone accounting for massive operating losses (KWFT logging a net loss after tax of over KSh 2.19 billion).
Structural Implication: Unsecured group-guarantee models and large legacy retail books have run into structural delinquency loops, where high NPL volumes demand aggressive provisioning that completely devours capital and pushes sector-wide core capital ratios to critical lows.
Representing the heaviest concentration of distress in the sector. KWFT and Faulu alone accounted for massive operating losses (KWFT logging a net loss after tax of over KSh 2.19 billion).
Unsecured group-guarantee models and large legacy retail books have run into structural delinquency loops. High NPL volumes demand aggressive provisioning that completely devours capital, pushing sector-wide core capital ratios to critical lows.
Investment Verdict
An asset class where portfolio delinquency is structurally baked into the customer segment, capital ratios are effectively wiped out near zero, and recovery mechanisms are economically unviable cannot generate safe risk-adjusted returns. For institutional allocators evaluating deployment options, the MFB NPL and capital crisis represents an unmitigated hazard.
Part 6: Investor Action Plan & Strategic Warning
The forensic evidence across asset contraction, multi-year bottom-line bleeding, structural competitive compression, and a complete collapse of regulatory capital ratios leads to one inescapable conclusion: investors are strongly advised to exit their positions immediately.
1. The Illusion of a Regulatory or Structural Workaround
A common fallacy among trapped investors is the belief that regulatory relief, strategic repositioning, or a fresh capital injection can revive a faltering microfinance bank. In the current Kenyan financial architecture, no such workaround exists:
Regulatory Impasse: With sector-wide core capital ratios scraping a disastrous 0.1% against the statutory 10% minimum, the Central Bank of Kenya’s enforcement powers leave little room for lenient forbearance without triggering mandatory receivership or statutory liquidation.
The Dead-End Mandate: There is simply no viable, profitable market left for standalone MFBs to serve in Kenya. The middle-income and prime micro-segment has been absorbed by agile Tier 1 commercial banks, rural and agricultural savings are captured by well-governed SACCOs, and emergency cash-flow liquidity is dominated by instant mobile lenders and digital credit providers.
2. The Unforgiving Math of Capital Exit
For institutional allocators, family offices, and private equity partners holding equity in Kenyan microfinance institutions, holding out for a turnaround is a high-risk value-destruction strategy.
Throwing Good Money After Bad: Pumping additional equity into an institution with a negative return on shareholders’ funds (-168.2%) functions merely as an operational subsidy for a broken model, rather than productive growth capital.
Lack of M&A Liquidity: Finding an acquirer for a sub-scale, loss-making financial institution with high non-performing loans and negative equity is practically impossible in a mature, consolidated banking market where larger institutions can organically scale without acquiring distressed legacy brick-and-mortar baggage.
3. Investor Action Plan
Allocators must take decisive steps to protect remaining portfolio value:
Immediate De-Risking: Write down asset valuations of MFB holdings to zero or near-zero to reflect true economic recovery values and prevent accounting illusions.
Aggressive Exit Negotiations: Pursue any available path to divest, merge, or surrender licenses before mandatory regulatory intervention forces a terminal, zero-recovery liquidation.
Capital Reallocation: Redirect trapped liquidity away from the microfinance trap and deploy capital toward resilient, high-performing alternative instruments—such as Tier 1 listed banking counters tracking the Nairobi Securities Exchange, government securities via DhowCSD, or top-tier Money Market Funds.
Concluding Verdict
Microfinance in Kenya has completed its historical lifecycle. What was once heralded as a pioneering vehicle for financial inclusion has calcified into an institutional capital trap. For astute investors, the only rational strategy is a swift, unhesitating exit.
About Boardlot Africa Research
Boardlot Africa is a premier financial intelligence and corporate governance publication dedicated to unpacking the mechanics of capital, market strategies, and structural shifts across East Africa’s corporate landscape. By bridging the gap between raw economic data and actionable market intelligence, we deliver deep-dive research, independent corporate analysis, and policy insights designed for institutional investors, boardrooms, and sharp market observers.
Get in Touch
Email: boardlot.research@gmail.com
Phone: +254 753 133 901
Substack: Subscribe to Boardlot Africa
X (Twitter): BoardLotSultan
Linkedn:): BoardLot Sultan