
This summary evaluates the performance and strategic divergence between South Africa’s Capitec Bank and Kenya’s Equity Group, highlighting why the South African "ecosystem" model is currently outpacing the Kenyan "regional empire" model in key financial metrics.
Comparing Kenya’s regional banking strategy against South Africa’s digital ecosystem model:
I. Introduction: The Clash of National Philosophies
II. The Profitability Gap: Return on Equity (ROE)
III. The Scale Paradox: Regional Empire vs. Single Market Depth
IV. The Efficiency Face-Off: Cost-to-Income Ratios (CIR)
V. Revenue Beyond Banking: The Value-Added Services (VAS) War
VI. Risk Management: Granular Data vs. Regional Volatility
VII. Global Strategy Divergence: Physical vs. Digital
VIII. The Local Front: Capitec vs. South Africa’s Traditional “Big Four”
IX. Conclusion: The Verdict on Depth vs. Breadth
The Platform Wars: Why Capitec is Outpacing the Kenyan Banking Giants
The narrative of African banking for the last decade has been defined by the aggressive regional expansion of Kenya’s Tier 1 banks. Led by Equity Group, and followed closely by KCB and Co-op Bank, the strategy was clear: build a physical and digital empire across East and Central Africa to tap into the “unbanked” millions in the DRC, South Sudan, and Rwanda. However, while the Kenyan giants were busy planting flags across borders, a different kind of financial monster was being built in Stellenbosch, South Africa.
Capitec Bank has emerged not just as a retail disruptor, but as the most efficient profit engine in African finance. By the end of its 2025 financial year, Capitec had achieved performance metrics that make regional diversification look like a burden rather than a blessing.
This is the story of how a bank focused on a single-market ecosystem is currently beating the Kenyan regional champions in the metrics that matter most to shareholders.
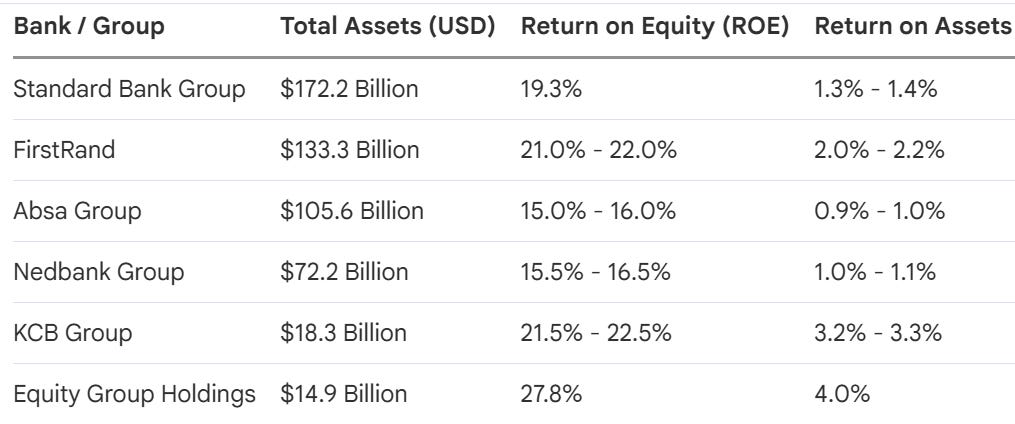
(Note: For comparison, South African Rand amounts have been converted to Kenyan Shillings using an approximate exchange rate of 1 ZAR = 7.0 KES).]

1. The Profitability Scoreboard: Return on Equity (ROE)
In the world of banking, Return on Equity (ROE) is the ultimate measure of how hard a bank’s capital is working. It is here that the divergence between the South African ecosystem model and the Kenyan regional model is most stark.
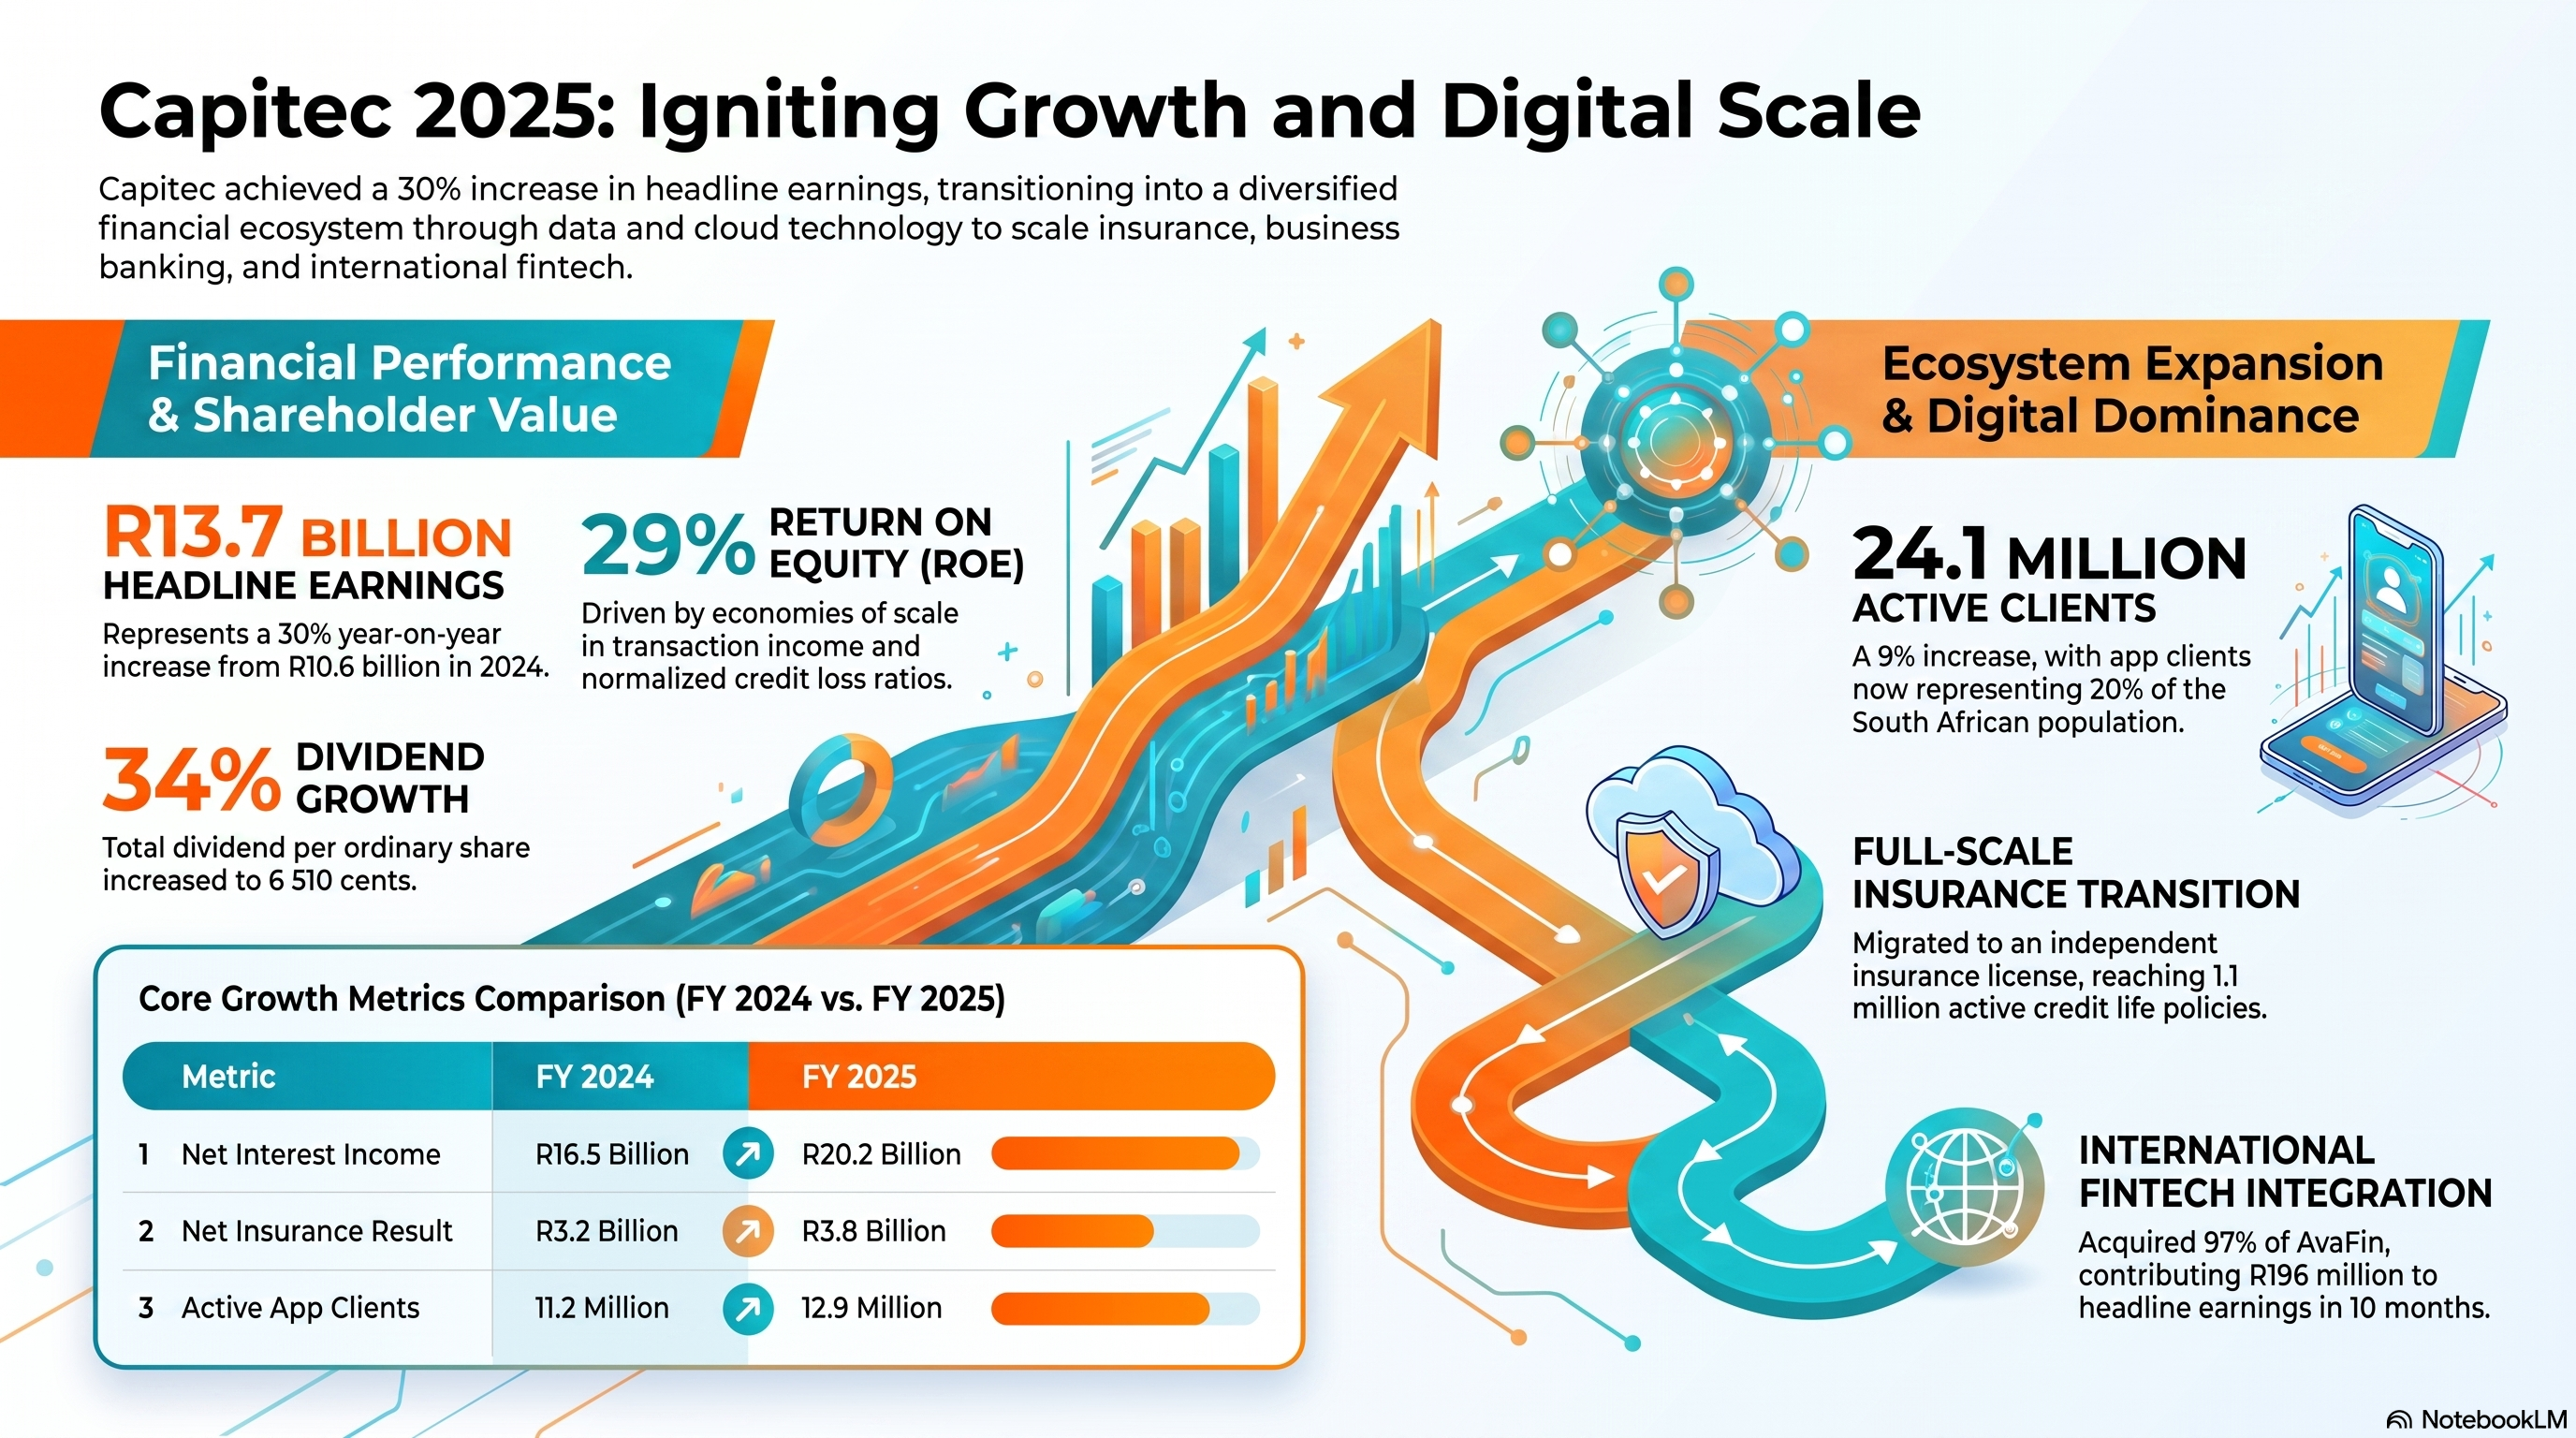
For the 2025 financial year, Capitec delivered a massive 29% ROE, climbing from 26% the previous year. This exceptional performance was driven by rising income from transactions and Value-Added Services (VAS), benefiting from immense economies of scale.
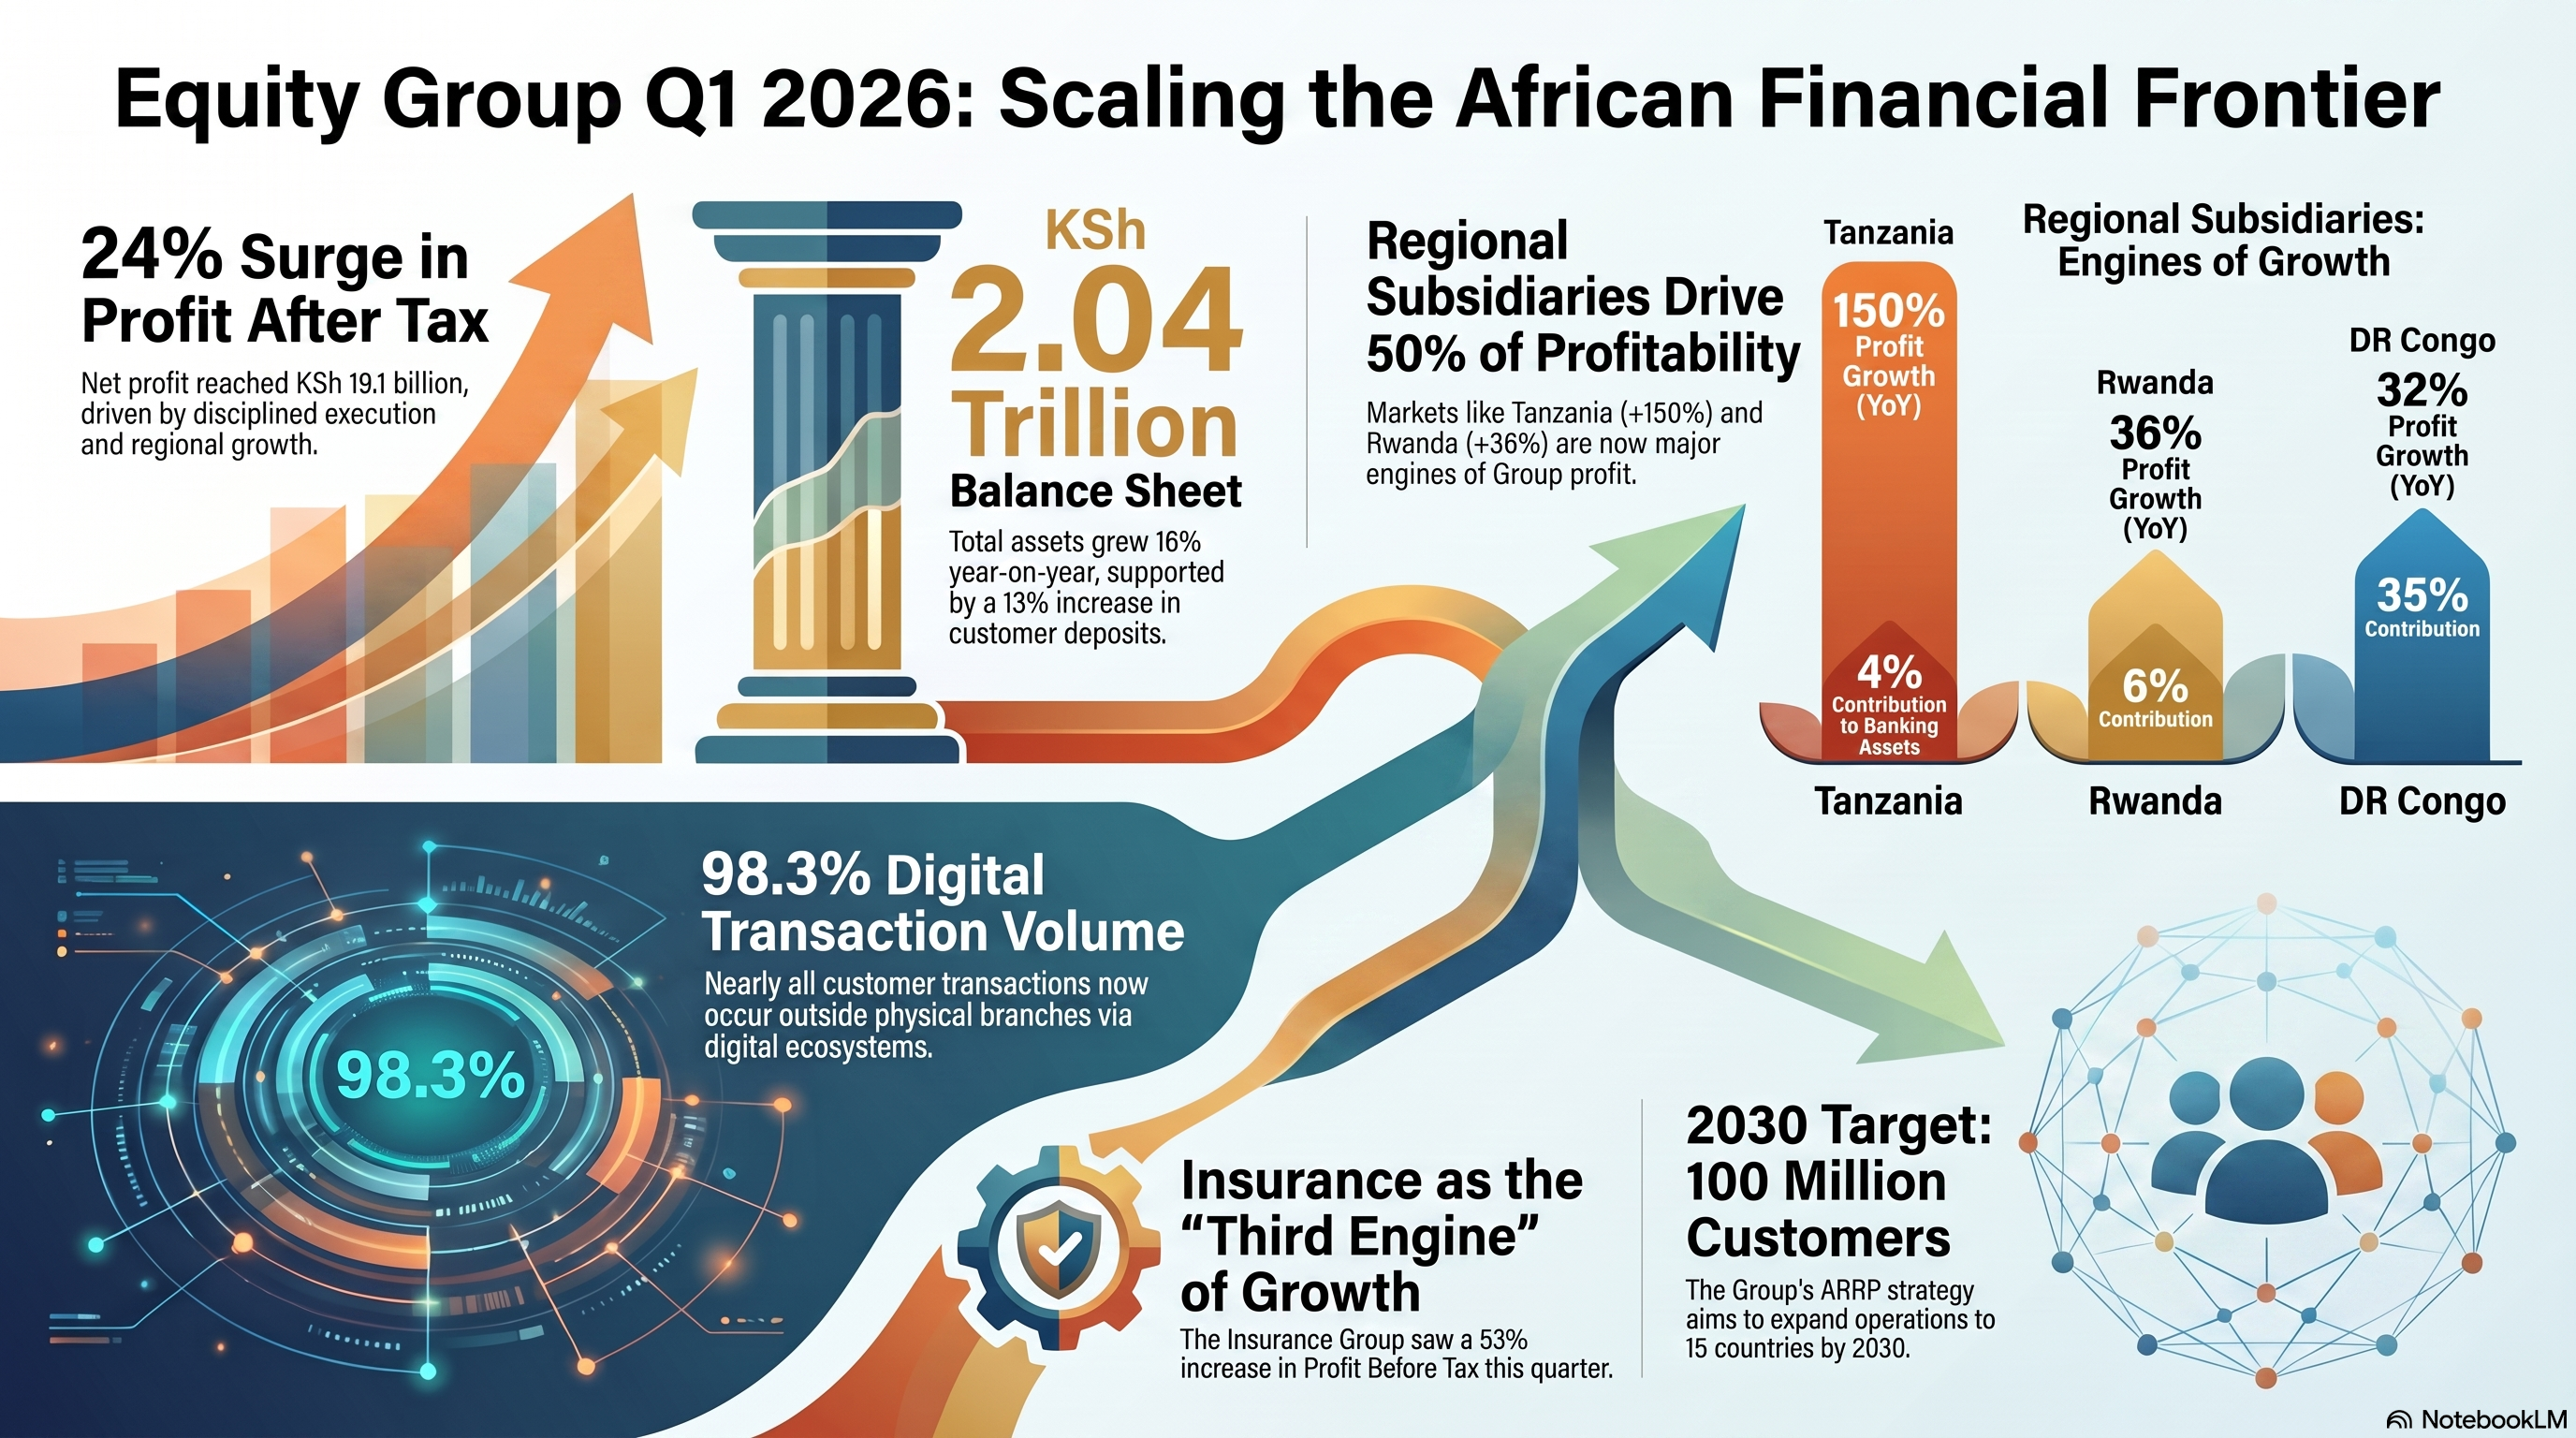
Compare this to Equity Group Holdings, which, despite being a formidable regional powerhouse, reported an ROE of 22.6% for Q1 2026. While Equity’s regional subsidiaries are growing rapidly—with its Tanzania unit recording a 150% growth in profit after tax—the overall group ROE still trails Capitec’s by over 600 basis points.
The lesson is clear: Capitec’s “high-volume, low-margin” model, which extracts value from 24 million clients in one regulatory environment, is currently more capital-efficient than the complex model of managing six different currencies and regulatory regimes.

2. The Scale Paradox: Single Market vs. Regional Empire
Kenyan banks have long argued that geographical breadth is their greatest strength. Equity Group currently operates in six countries, with a representative office in Ethiopia, and aims to serve 100 million customers by 2030 under its Africa Recovery and Resilience Plan (ARRP). As of early 2026, Equity Group serves 22.7 million customer accounts.
However, Capitec has achieved greater scale within the borders of South Africa alone. As of February 2025, Capitec reached 24.1 million active clients—adding nearly 2 million in a single year. This means Capitec has a larger active customer base in its home country than Equity Group has across its entire regional empire.
This concentration allows for staggering operational leverage. Capitec now serves 20% of the entire South African population through its app alone, with 12.9 million active app users. When your client base represents nearly 40% of a nation’s population, the incremental cost of a new transaction drops toward zero, a feat hard to replicate while still building basic physical infrastructure in markets like the DRC or South Sudan.

3. The Efficiency Face-Off: Cost-to-Income Ratios (CIR)
The Cost-to-Income Ratio (CIR) is perhaps the most revealing metric of the “hidden price” of regional physical expansion versus local digital depth.
Equity Group’s CIR (without provisions) stood at 50.6% in Q1 2026. While this represents a significant improvement from the 54.2% reported in the previous period—reflecting gains from shared services and digital migration—it highlights the heavy lifting required to maintain a multi-country empire. Operating across six nations means managing six sets of regulatory compliance, separate marketing budgets, and the infrastructure costs for nearly 87,000 agency outlets.
Capitec, by contrast, operates with surgical leanness. Its CIR for the 2025 financial year was approximately 42.6% (calculated from operating expenses of R18.1 billion [approx. KSh 126.7 billion] against a total income of R42.5 billion [approx. KSh 297.5 billion]).
This efficiency gap is driven by Capitec’s mastery of digital migration, with 90% of its transaction volumes now occurring through digital channels. This has allowed them to repurpose their 880 branches from expensive “transaction hubs” into “sales centers,” keeping cash processing and distribution costs to a mere 4% growth despite massive overall volume increases. While Equity is effectively using “One Equity” shared assets to lower costs, the sheer complexity of a pan-African model naturally creates a higher cost floor than Capitec’s high-volume, single-market ecosystem.

4. The “Beyond Banking” Ecosystem
Capitec’s most significant performance lead comes from its evolution into a digital utility platform. While Kenyan banks have high digital migration—Equity reports that 98.3% of transactions now happen outside of branches—Capitec has turned that digital traffic into a proprietary marketplace.
Capitec’s Value-Added Services (VAS) and Capitec Connect (its MVNO) are the stars of the show. Non-interest income now accounts for 67% of Capitec’s income from operations after credit impairments. In FY2025:
VAS and Connect income surged 61% to R4.4 billion (approx. KSh 30.8 billion).
The bank sold 308 million vouchers, and 1.2 million new clients used its “send cash” feature.
80% of Capitec Connect sales occur directly inside the banking app.
Equity is following a similar path with its Technology Group and Insurance Group, reporting a 30% increase in gross written premiums, but it is still being integrated as a “third engine” rather than the dominant force that VAS has become for Capitec.

5. Risk Management: AI vs. Volatility
Kenya’s banking sector has recently battled high Non-Performing Loan (NPL) ratios, which average around 15.6% for the industry. Equity Group has significantly outperformed the industry average, managing a group NPL ratio of 10.6%.
However, Capitec is playing a different game using data science. Despite South Africa’s subdued economic environment, Capitec managed to decrease its annualized credit loss ratio to 7.5%, down from 8.7%.
The “secret sauce” is Capitec’s use of AI-driven “Next Best Action” automated decisions. By leveraging quality data to personalize experiences and prompt actions across all channels, Capitec manages retail risk with a level of granularity that physical-heavy regional models often struggle to match.
6. The Global Pivot: Physical vs. Digital
Perhaps the most interesting divergence is in international strategy.
The Kenyan Model: Equity and KCB are expanding by acquiring physical banks in neighboring countries. Equity’s acquisition of EBCDC in the DRC has been a major driver, with the subsidiary now accounting for 31% of the group’s asset base.
The Capitec Model: Capitec is expanding through Global Digital Lending. Their acquisition of AvaFin gives them a foothold in five international markets, including Poland, Spain, and Mexico.
AvaFin operates with an ROE exceeding 40%. Instead of buying bricks and mortar in volatile regional markets, Capitec is exporting its digital lending “secret sauce” to high-yield foreign markets. AvaFin contributed R196 million (approx. KSh 1.37 billion) to group headline earnings in just 10 months, proving that a bank doesn’t need a branch in Kinshasa to find international growth.

Conclusion: The Verdict EA vs SA
The Kenyan banks are the architects of African regionalism. They are doing the hard work of integrating the continent’s economies, and their long-term vision of serving 100 million people is noble and strategically ambitious.
But today, the crown of financial performance belongs to Capitec. By building a “financial utility” ecosystem for 24 million people and operating at an enviable 42.6% efficiency ratio, Capitec has built a more profitable and lean engine.
In the battle for African banking supremacy, the Kenyan giants have the breadth, but Capitec has the depth. And for now, depth is winning the race. 🇿🇦🇰🇪🏦
The Local Front: Capitec vs. South Africa’s Traditional “Big Four”
While Capitec is currently winning the efficiency battle against regional giants like Equity Bank, its performance relative to its domestic peers—Absa, FirstRand (FNB), Nedbank, and Standard Bank—is equally striking. In the South African context, Capitec has moved from a “challenger” to a dominant market leader in several key metrics.
1. Profitability: Doubling the Industry Benchmark
Capitec uses the performance of the “Big Four” as its primary benchmark for shareholder returns. For its 2025 financial year, Capitec delivered a 29% Return on Equity (ROE). To put this in perspective, Capitec’s long-term incentive targets for executives are set to vest fully only if they outperform the average ROE of the traditional Big Four banks by at least 2%. The internal benchmark for this three-year average was set at 17.1%. By achieving 29%, Capitec is essentially operating at a level of capital efficiency nearly double that of the traditional South African banking industry average.
2. Market Dominance in Modern Payments
Capitec is not just keeping pace with traditional banks; it is leading the adoption of new financial technology in South Africa. A prime example is PayShap, the country’s rapid interbank payment system. Capitec currently holds a massive 56% market share of all PayShap main bank registrations and processed 52% of all PayShap transactions in the industry for 2025. This level of dominance in a new, high-tech payment rail suggests that Capitec is successfully capturing the future of South African transaction volumes far more effectively than its older, more established competitors.
3. Disruption through Pricing and Insurance
Capitec continues to use its “high-volume, low-margin” business model to disrupt the status quo. On 1 March 2025, the bank further simplified its transaction pricing, reducing fees for both Personal and Business banking clients to just five key price points. Furthermore, its move into the insurance sector is built on a strategy of aggressive price competition; Capitec’s insurance products are currently priced approximately 30% below the South African market average. By leveraging its lower operating costs, Capitec is able to underprice traditional insurers and the insurance arms of the “Big Four” while still maintaining high margins.
4. Operational Resilience and Talent Retention
Capitec’s efficiency isn’t just limited to its balance sheet; it extends to its workforce. While the South African banking industry faces a voluntary employee attrition benchmark of 15.6%, Capitec’s attrition rate is significantly lower at 11.6%. This stability allows the bank to maintain a consistent service culture, which it identifies as a core “competitive advantage” that is difficult for traditional rivals to replicate.
In summary, Capitec is not only outpacing its Kenyan counterparts but is also setting a new standard for performance within South Africa. By maintaining an ROE that towers over the Big Four and capturing more than half of the country’s modern payment registrations, Capitec has transitioned from a niche retail player into the undisputed efficiency king of the South African financial landscape. 🇿🇦🏦