
The NSE Pay Scale: Ranking Kenya’s Highest-Paid CEOs (FY2025/26)
Part 1: The Great ESOP Rethink & The Ranking
For years, corporate Kenya relied on Employee Share Ownership Plans (ESOPs) as the primary mechanism to align leadership incentives with shareholder value. The concept was straightforward: grant executives and key staff an equity stake, and their personal wealth will move in lockstep with the company’s long-term performance. In practice, however, legacy ESOP structures on the Nairobi Securities Exchange (NSE) have run into a wall of market realities.
At recent Annual General Meetings (AGMs), shareholders voted decisively to dismantle these long-standing schemes. Car & General (K) Ltd voted to delete Article 7 of its Articles of Association and dissolve its ESOP trust in favor of direct, cash-based performance incentives, recognizing that an illiquid share structure failed to offer real retention value for management or tangible returns for equity holders. Similarly, structural unwinds and restructuring debates surrounding legacy share schemes at Kenya Airways highlight a growing realization across boardroom tables: static, illiquid equity trusts on a thin exchange often deliver neither executive retention nor market alignment.
The Market Shift: Cash Bonuses and Open-Market Acquisitions
As traditional ESOP trusts sunset across the exchange, corporate boards are converging on two primary models to restructure executive compensation:
The Non-Dilutive Open-Market Model: Exemplified by Safaricom PLC, where the company purchases existing shares directly from the open market for executive performance awards—creating buying demand without diluting retail equity.
The Direct Performance Cash Model: Utilized heavily by major financial institutions, where variable cash bonuses are anchored directly to short- to medium-term Return on Equity (ROE), operational efficiency, and profit milestones.
As boardrooms shift toward these direct incentive mechanisms, a broader governance question emerges: Who are the highest-paid executives in Kenya, and how cleanly does their compensation align with actual shareholder value creation?
Section 1: Ranking CEO Pay – From Smallest to Largest (FY2025 Base)
To analyze executive compensation across the NSE, we establish a benchmark grounded in audited financial reports for the FY2025 reporting cycle. Executive pay across listed counters roughly divides into three distinct tiers.
1. The Small-Cap & Distressed Level (KES 15M – KES 35M)
At the lower end of the NSE compensation spectrum sit executives managing smaller industrial, agricultural, or micro-cap listed entities. Compensation packages here range between KES 15 million and KES 35 million annually, consisting almost entirely of basic base salary with minimal to zero variable cash bonuses or equity grants due to tight operating margins or turnaround pressures.
2. The Mid-Tier (FMCG, Investment & Media Giants) (KES 60M – KES 120M)
This tier features leadership at mid-to-large-cap non-banking corporations where compensation reflects substantial corporate turnover, though base salary forms the vast majority of total pay:
Dr. James Mworia (Centum Investment): KES 64.52 million (Comprising KES 60.02 million basic salary and KES 4.50 million pension contributions; zero performance bonus was declared or paid for FY2025).
Jane Karuku (East African Breweries PLC): ~KES 85 million – KES 105 million (Combining base executive pay, utility allowances, and short-term performance incentives).
3. The Top Tier: The Banking & Telecom Ranking
The top tier of executive compensation in Kenya remains overwhelmingly dominated by Tier-1 banking leaders and telecom executives. Driven by record profitability, extensive regional balance sheets, and heavy variable bonus allocations, these six executives represent the apex of listed corporate pay in Kenya:
1. Dr. Gideon Muriuki (Co-operative Bank of Kenya) — ~KES 474.8 Million
Structure & Drivers: Base salary combined with a heavy performance cash bonus tied to Tier-1 return on equity (ROE) and cost-to-income efficiency.
2. Peter Ndegwa (Safaricom PLC) — ~KES 324.5 Million
Structure & Drivers: Basic salary, short-term performance bonus, and non-dilutive open-market share awards under the firm’s Executive Performance Share Award Plan (EPSAP).
3. Dr. James Mwangi (Equity Group Holdings) — ~KES 275.7 Million
Structure & Drivers: Consolidated base executive pay, utility allowances, and group-level performance incentives.
4. Paul Russo (KCB Group PLC) — ~KES 250.2 Million
Structure & Drivers: Executive salary plus variable cash bonuses linked to regional profit recovery and capital optimization.
5. John Gachora (NCBA Group PLC) — ~KES 208.4 Million
Structure & Drivers: Fixed executive salary plus short-term performance bonuses tied to net earnings growth and regional expansion.
6. Dr. James Mworia (Centum Investment Co.) — KES 64.52 Million
Structure & Drivers: Fixed executive salary (KES 60.02M) plus pension contributions (KES 4.50M); represents the top non-banking earner in fixed base pay.
(Note: Figures derived from audited FY2025 Directors’ Remuneration Reports submitted to the Capital Markets Authority).
Part 2: The Alignment Matrix & The Centum Benchmark
Section 2: The Expanded Alignment Matrix (2025 Pay Growth vs. Stock Price Movements)
To evaluate whether executive compensation tracks total shareholder return (TSR), we analyze CEO earnings in KES for the current reporting period (FY2025), the prior year (FY2024), and their year-over-year percentage growth alongside calendar-year stock performance. While major Tier-1 banks and beverage leaders experienced strong price recoveries and upward stock corrections off multi-year lows, holding companies and legacy illiquid counters faced valuation disconnects.
1. The Pay Growth & Share Price Matrix
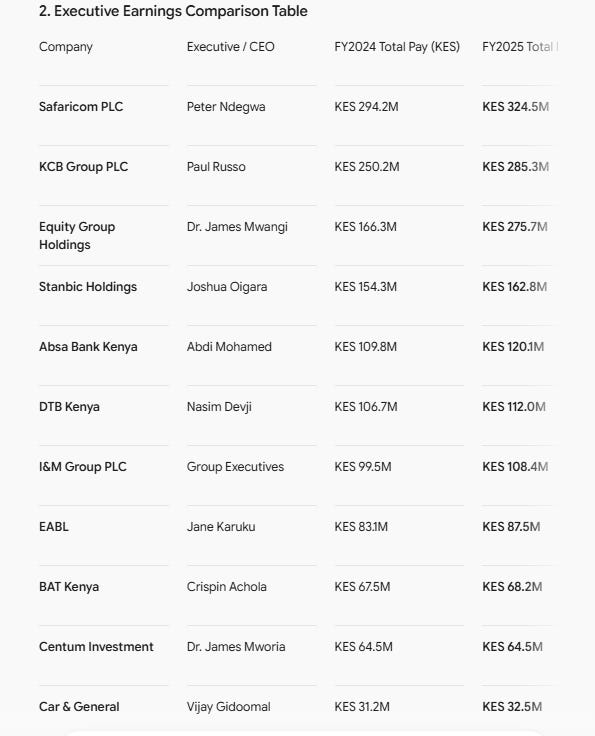
KCB Group PLC (Paul Russo)
FY2025 CEO Pay: KES 285.3 Million
FY2024 CEO Pay: KES 250.2 Million
Pay Growth: +14.0%
Stock Price Movement (Jan–Dec 2025): Upward Rally (+25% to +35%)
Alignment Rating: High Alignment. Compensation growth was driven by a KES 118.6M cash bonus as regional asset quality stabilized and non-performing loan provisions eased.
Equity Group Holdings (Dr. James Mwangi)
FY2025 CEO Pay: KES 275.7 Million
FY2024 CEO Pay: KES 166.3 Million
Pay Growth: +65.8%
Stock Price Movement (Jan–Dec 2025): Major Valuation Rebound (+70% to +90%)
Alignment Rating: High Alignment. Following years of compressed equity valuations, the stock experienced a sharp upward correction alongside a 52% jump in group profit before tax (KES 92.1B) and record dividend declarations.
Safaricom PLC (Peter Ndegwa)
FY2025 CEO Pay: KES 324.5 Million
FY2024 CEO Pay: KES 294.2 Million
Pay Growth: +10.3%
Stock Price Movement (Jan–Dec 2025): Strong Price Rally (+80% to +100%)
Alignment Rating: High Alignment. Executive pay growth lagged the significant stock price recovery from KES 14–15 lows to clear KES 30+, backed by solid net profit expansion.
Absa Bank Kenya (Abdi Mohamed)
FY2025 CEO Pay: KES 120.1 Million
FY2024 CEO Pay: KES 109.8 Million
Pay Growth: +9.4%
Stock Price Movement (Jan–Dec 2025): Upward Correction (+30% to +45%)
Alignment Rating: High Alignment. Solid return on average equity (ROAE) and double-digit profit growth directly supported balanced variable payouts.
East African Breweries PLC - EABL (Jane Karuku)
FY2025 CEO Pay: KES 87.5 Million
FY2024 CEO Pay: KES 83.1 Million
Pay Growth: +5.3%
Stock Price Movement (Jan–Dec 2025): Upward Rebound (+35% to +50%)
Alignment Rating: High Alignment. Stock value corrected upward as input cost pressures eased and regional net profit rebounded 16% to KES 9.47B.
Car & General (Vijay Gidoomal)
FY2025 CEO Pay: KES 32.5 Million
FY2024 CEO Pay: KES 31.2 Million
Pay Growth: +4.2%
Stock Price Movement (Jan–Dec 2025): Massive Price Rebound / Correction (+120%+)
Alignment Rating: Structural Realignment. Despite a massive stock price recovery following years of severe low valuations, shareholders voted to scrap the legacy ESOP trust—recognizing that illiquid equity pools offered poor retention compared to direct cash performance models.
I&M Group PLC (Kihara Maina / Exec Team)
FY2025 CEO Pay: KES 108.4 Million
FY2024 CEO Pay: KES 99.5 Million
Pay Growth: +8.9%
Stock Price Movement (Jan–Dec 2025): Significant Rally (+45% to +65%)
Alignment Rating: High Alignment. Driven by strong double-digit corporate banking profit growth and regional subsidiary contributions.
Diamond Trust Bank Kenya - DTB (Nasim Devji)
FY2025 CEO Pay: KES 112.0 Million
FY2024 CEO Pay: KES 106.7 Million
Pay Growth: +5.0%
Stock Price Movement (Jan–Dec 2025): Steady Rally (+20% to +35%)
Alignment Rating: Moderate Alignment. Rebound in asset quality and net interest income supported conservative executive variable payouts.
Stanbic Holdings PLC (Joshua Oigara)
FY2025 CEO Pay: KES 162.8 Million
FY2024 CEO Pay: KES 154.3 Million
Pay Growth: +5.5%
Stock Price Movement (Jan–Dec 2025): Moderate Growth (+15% to +25%)
Alignment Rating: Moderate Alignment. Consistent fee income and corporate advisory deals kept both share price and executive incentives well-supported.
BAT Kenya PLC (Crispin Achola)
FY2025 CEO Pay: KES 68.2 Million
FY2024 CEO Pay: KES 67.5 Million
Pay Growth: +1.0%
Stock Price Movement (Jan–Dec 2025): Range-Bound / Flat (High Dividend Yield ~12%)
Alignment Rating: Dividend-Anchored. While capital gains remained stagnant, executive compensation was heavily anchored to high cash distribution ratios.
Centum Investment Co. (Dr. James Mworia)
FY2025 CEO Pay: KES 64.5 Million
FY2024 CEO Pay: KES 64.5 Million
Pay Growth: 0.0% (Zero performance bonus declared)
Stock Price Movement (Jan–Dec 2025): Stagnant / Negative (-5% to -12%)
Alignment Rating: Misaligned. While management held fixed base compensation steady, the stock continued to trade at a deep ~80% discount to reported Net Asset Value (NAV) per share.
2. Executive Earnings Comparison Table
Section 3: The Centum Benchmark – The Valuation Disconnect
Centum Investment provides a critical case study regarding executive incentives, accounting valuation, and public market pricing on the NSE.
1. Fixed Pay vs. Historical Bonus Cycles
In FY2025, Dr. James Mworia’s total remuneration stood flat at KES 64.52 million (KES 60.02M base salary and KES 4.50M pension, with zero variable performance bonus). While this reflects cost discipline today, historical performance-driven bonus payouts—which previously pushed executive compensation into KES 200M–375M+ territory during asset revaluation cycles—created long-standing shareholder friction.
2. The Hurdle Rate and Paper Gains Flaw
Centum’s legacy incentive schemes relied on an internal hurdle rate (a 15% return on net asset value). During expansion cycles, management was rewarded based on fair-value asset markups and book valuations. However, when these book revaluations failed to translate into liquid market capitalization or consistent cash distributions, public shareholders were left holding discounted equity while variable performance pools had already been disbursed.
3. The NAV Discount Paradox
Centum’s reported Net Asset Value (NAV) per share stands at KES 66.93 – KES 69.47. Yet, the stock trades on the open market at roughly KES 13.50 – KES 14.50, representing an 80% discount to book value.
Centum book value vs market price FY2025/26
Reported NAV per share Kes. 69.47
NSE Market Trade Price 14.00
Implied Market Discount 79.8%
This discount highlights the core dilemma for listed investment holding entities:
Illiquid Real Estate Bets: The strategic pivot away from high-cash-yielding equities into long-gestation real estate developments (Two Rivers, Vipingo) locked up capital.
Public Market Skepticism: Investors price the stock based on dividend yield and cash flow generation rather than internal fair-value property appraisals.
Section 4: Other Controversial Executive Compensation Packages
Kenya Airways (KQ): High executive retention allowances amid ongoing operational bailouts and multi-billion shilling net losses create ongoing public relations friction regarding taxpayer-funded corporate turnarounds.
The “Bonus vs. Dividend” Conflict: Certain NSE-listed industrial and agricultural counters have faced shareholder pushback for maintaining executive variable pay pools during years when shareholder dividends were either reduced or suspended entirely.
Section 5: Benchmarking Against Global & Regional Markets
JSE (South Africa): Mandates binding “Say-on-Pay” voting frameworks. If more than 25% of shareholders vote against the remuneration report, the board is required to formally engage dissenting investors and restructure the incentive model.
NGX (Nigeria): Tier-1 Nigerian bank executives receive significant variable pay, but listed entities maintain higher dividend payout ratios, mitigating retail investor dissatisfaction.
Global Best Practice (S&P 500 / FTSE 100): Boards enforce strict clawback provisions (reclaiming variable bonuses if asset revaluations or earnings are later restated) and mandate minimum shareholding requirements for sitting CEOs.
Section 6: The Wage Chasm – CEO Pay vs. Formal and Informal Sector Multiples
National Income Benchmarks (KNBS Statistics):
Average Formal Sector Wage: According to the Kenya National Bureau of Statistics (KNBS) Economic Survey, the national average formal wage sits at KES 77,758 per month (~KES 933,100 per year).
Median Formal Sector Worker: KNBS distribution data shows nearly half of formal employees earn below KES 30,000 per month (~KES 360,000 per year), putting the median formal wage at roughly KES 50,000 per month (~KES 600,000 per year).
Average Informal Sector Worker: Representing over 80% of Kenya’s total labor force, the typical informal sector worker earns an estimated KES 20,000 per month (~KES 240,000 per year).
The Disparity Matrix: Executive Pay vs. Kenyan Earnings
| Executive Category | Top CEO Pay (FY2025/26) | vs. Informal Worker (KES 20k/mo | KES 240k/yr) | vs. Median Formal Worker (KES 50k/mo | KES 600k/yr) | vs. Average Formal Wage (KES 77.8k/mo | KES 933k/yr) |
| Top Banking & Telecom (e.g., Safaricom, KCB, Equity) | KES 275M – KES 324.5M | 1,145x to 1,352x | 458x to 541x | 295x to 348x |
| Tier-1 Financials & FMCG (e.g., Stanbic, Absa, DTB, EABL) | KES 87.5M – KES 162.8M | 365x to 678x | 146x to 271x | 94x to 174x |
| Mid-Tier Non-Banking (e.g., Centum, BAT) | KES 64.5M – KES 68.2M | 269x to 284x | 108x to 114x | 69x to 73x |
Key Multiples & Takeaways:
The Informal Worker Chasm: Safaricom’s CEO annual compensation (KES 324.5M) equals 1,352 years of earnings for an average informal worker taking home KES 20,000 per month. It takes a Tier-1 bank chief just 6 hours of working time to match what an informal worker earns in an entire year.
The Formal Median Divide: Compared to a formal employee in the middle wage bracket (KES 50,000/mo), executives at Kenya’s top three listed firms earn between 458x and 541x the worker’s annual income.
Socio-Economic Strain: These vast earning gaps draw increasing scrutiny from institutional investors, labor organizations, and ESG frameworks. As aggressive statutory deductions (SHIF, Housing Levy, and NSSF tier increases) compress net take-home pay for lower- and middle-income households, corporate boards face rising demand to justify multi-hundred-million-shilling executive packages relative to baseline wage growth.
Data Sources & References
National Sector Earnings: Kenya National Bureau of Statistics (KNBS) Economic Survey (Formal Sector Wage Earnings & Informal Employment Statistics).
Executive Compensation Figures: Audited Directors’ Remuneration Reports filed with the Capital Markets Authority (CMA) and the Nairobi Securities Exchange (NSE).
Conclusion: The Governance Playbook for 2026
1. Aligning Executive Pay Directly with Shareholder Value Creation
The historical disconnect between executive remuneration and actual shareholder returns highlights an urgent need to re-engineer incentive frameworks across the Nairobi Securities Exchange. Executive variable pay must no longer be insulated by paper gains or fair-value accounting adjustments.
Tie Performance Bonuses to Realized Shareholder Returns: Variable compensation pools should be directly indexed to Total Shareholder Return (TSR)—specifically defined as open-market stock price appreciation and actual cash dividends distributed to investors.
Eliminate Unearned “Paper Gain” Bonuses: Legacy incentive models that reward management on uncollected, mark-to-model asset revaluations (such as real estate book gains) create perverse incentives. Executive bonuses must depend on realized cash flows and cash-generating operational metrics.
Mandate Non-Dilutive Open-Market Equity Purchases: Corporate boards should phase out legacy ESOP trusts and adopt non-dilutive share acquisition models—similar to Safaricom’s Executive Performance Share Award Plan—where performance equity is purchased directly from the open market, supporting share price liquidity while providing executives genuine skin in the game.
2. Strengthening CMA and NSE Regulations on “Say-on-Pay”
To protect investor interests and establish accountability across listed counters, the Capital Markets Authority (CMA) and the Nairobi Securities Exchange (NSE) must enhance existing governance codes to grant shareholders direct, enforceable oversight over executive compensation.
Institute Mandatory Binding “Say-on-Pay” AGM Votes: Regulatory frameworks should evolve beyond non-binding advisory disclosures to mandate binding shareholder votes on Directors’ Remuneration Reports at every AGM.
Enforce Engagement Thresholds for Voting Disapproval: Adopting international standards (such as South Africa’s JSE rules), if more than 25% of voting shareholders reject a company’s remuneration policy, the board should be legally required to formally engage dissenting investors and publicly publish an updated policy within six months.
Standardize Transparency on Wage Ratios & Clawbacks: The CMA should mandate standardized disclosures comparing CEO total compensation against median employee earnings, alongside statutory clawback provisions that allow boards to recover variable bonuses if underlying financial metrics or asset valuations are subsequently restated.
About Boardlot Africa Research
Boardlot Africa is a premier financial intelligence and corporate governance publication dedicated to unpacking the mechanics of capital, market strategies, and structural shifts across East Africa’s corporate landscape. By bridging the gap between raw economic data and actionable market intelligence, we deliver deep-dive research, independent corporate analysis, and policy insights designed for institutional investors, boardrooms, and sharp market observers.
Get in Touch
Email: boardlot.research@gmail.com
Phone: +254 753 133 901
Substack: Subscribe to Boardlot Africa
X (Twitter): BoardLotSultan