
Why Reinvesting Your Safaricom Dividend Could Be Your Best Investment Decision in 2026
Safaricom (SCOM) has firmly re-established itself as the anchor of Kenyan dividend portfolios. Following a spectacular financial recovery driven by robust domestic data growth, M-PESA monetization, and stabilizing capital expenditure in Ethiopia, the telco has signaled an aggressive return to shareholder rewards.
With a total Dividend Per Share (DPS) of KSh 2.00 for FY2026 (comprising an interim KSh 0.85 and a final KSh 1.15) and a current share price hovering around KSh 30.90, SCOM is flashing a forward dividend yield of 6.5%. For long-term investors, this is no longer just a defensive stock; it is a high-conviction compounding machine.
Key Numbers at a Glance
Total Safaricom Shares Outstanding: 40.06 Billion shares.
Total FY2026 Dividend Payout: KSh 80.12 Billion total capital injection into the economy.
The Free Float (Minority Holdings): 25% of total equity (~10.015 Billion shares).
Retail Slice (Local & EA Individuals): 4.2% of total equity (~1.68 Billion shares, representing ~16.8% of the available free float).
The Retail Pool Value: KSh 3.37 Billion gross (KSh 3.20 Billion net after 5% withholding tax) distributed to everyday investors.
Total Retail Accounts Involved: ~510,000 active individual retail registries.
Book Closure Date (Ex-Dividend Date): ~August 5, 2026 (Must own shares by this date to qualify).
Payment Date: ~September 4, 2026.
1. The Macro Scale: Where the KSh 80 Billion Flow Goes
To understand the sheer magnitude of this payout, we have to look closely at Safaricom’s capital structure. A KSh 2.00 per share payout means the corporate ecosystem is transferring an unprecedented amount of liquidity directly back into the hands of equity holders.
While institutional giants take the lion’s share, the retail segment represents a massive micro-economy of its own.
The FY2026 Ownership & Dividend Distribution Matrix
Vodacom Group & Vodafone: Holds 40.0% of equity with 16.02 Billion shares, receiving a gross dividend of KSh 32.05 Billion.
Government of Kenya: Holds 35.0% of equity with 14.02 Billion shares, receiving a gross dividend of KSh 28.04 Billion.
Institutional Free Float: Holds 20.8% of equity with 8.33 Billion shares (composed of NSSF, local, and foreign funds), receiving a gross dividend of KSh 16.66 Billion.
Retail Investors: Holds 4.2% of equity with 1.68 Billion shares (composed of local and East African individuals), receiving a gross dividend of KSh 3.37 Billion.
Total Ecosystem: Consists of 100.0% ownership totaling 40.06 Billion shares outstanding, representing a gross payout of KSh 80.12 Billion.
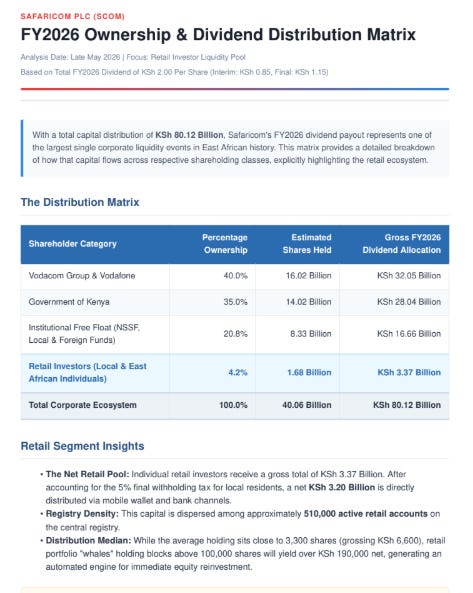
The Retail Impact Impact: The mean retail holding sits at roughly 3,300 shares (grossing KSh 6,600). However, the top tier of retail “whales” holding between 100,000 and 1,000,000+ shares are positioned to absorb substantial liquidity injections this September.
2. Core Reinvestment Strategies
Because Safaricom does not offer an official, company-sponsored Dividend Reinvestment Plan (DRIP) that bypasses the exchange, reinvestment must be executed either manually or via modern broker tools. Here are the four primary frameworks for retail investors:
A. Pure Compounding (100% Reinvestment Model)
The Mechanics: Every shilling received in net dividends is immediately redirected to purchase more SCOM shares, utilizing modern trading platforms (such as mobile-based trading apps like Ziidi Trader, or legacy broker desks like NCBA Investment Bank and SBG Securities) to absorb fractional or small-lot allocations.
The Math: If you start with 10,000 shares today and reinvest a flat KSh 2.00 dividend annually at a static share price of KSh 30.90 (assuming zero capital appreciation or dividend growth for conservative modeling):
Year 5: You will own ~13,700 shares.
Year 10: You will own ~18,700 shares (+87% increase in share count, effectively doubling your passive income stream through share accumulation alone).
B. The Hybrid “CapEx & Compound” Model
The Mechanics: Reinvest 70% to 80% of the dividend payout to maintain portfolio growth, while drawing down 20% to 30% in cash.
The Lifestyle Fit: Highly suited for lifestyle integration—such as investors with active commercial farming operations. For instance, the cash portion can directly fund seasonal farm inputs (fertilizer, vet services, or feedlot operations) while the core holding continues to scale quietly in the background.
C. Dividend Dollar-Cost Averaging (DCA)
The Mechanics: By committing to reinvesting the payout on the exact week of distribution, you strip emotion out of the market.
Why it matters now: The NSE frequently experiences localized liquidity swings and macro-induced volatility. Reinvesting automatically ensures you buy more shares when macro pressures temporarily suppress SCOM’s price, and fewer shares when the market rallies.
D. Cost & Tax Optimization Notes
Withholding Tax: Dividends attract a 5% withholding tax for local residents, which is a final tax. Your net distribution is KSh 1.90 per share.
Slippage Management: Manual reinvestment triggers standard NSE statutory transaction fees (~1.81% to 2.1% depending on volume and broker). To minimize tax and fee drag, avoid piecemeal buying; batch your dividend cash with fresh monthly capital to cross minimum brokerage fee thresholds cleanly.
3. Advanced Wealth-Building Tactics
The Scale Effect (The 100K Share Threshold)
At the retail level, minor dividend payouts can feel negligible. However, crossing structural psychological thresholds changes the game. If an investor holds 100,000 shares, a single year’s net dividend clears KSh 190,000. At current valuations, that automated payout alone injects an additional ~6,140 shares back into the portfolio annually without a single shilling of out-of-pocket capital.
Equity Market Laddering
While SCOM provides an incredible tech-and-consumer-spend proxy, smart portfolios pair it alongside Tier-1 banking giants (like Equity Group, Co-op Bank, or KCB). This balances your cash flow calendar across the year:
[Mar/Apr: Bank Finals] ➔ [May: SCOM Interim] ➔ [Jul/Aug: Bank Interims] ➔ [Sep: SCOM Final]
4. Risks to Keep on Your Radar
Concentration Risk: SCOM represents roughly 40% of the total market capitalization of the Nairobi Securities Exchange. Over-allocating your dividend payouts solely into Safaricom binds your net worth entirely to a single corporate entity. Regulatory interventions, unexpected changes in excise duty on airtime/data, or foreign exchange shocks out of Ethiopia remain real risks to monitor.
The Strategic Verdict for the @BoardLotSultan Community
If you are in the Accumulation Phase: Aggressive, frictionless 100% reinvestment is the optimal play. The current valuation gap between SCOM’s market price and its long-term intrinsic value presents a rare window to acquire high-yield equity.
If you are in the Income/Maintenance Phase: Pivot to the hybrid model. Let the stock protect your purchasing power while utilizing the liquid cash payouts to de-risk into tangible cash-flow assets, like debt-free commercial farming units or short-term treasury bills.
How are you planning to allocate your upcoming September final dividend?
To model the long-term wealth-generation capacity of Safaricom (SCOM) over a 10-year horizon, we must evaluate the compounding effect of automated dividend reinvestment under three distinct growth scenarios.
Core Baseline Parameters
Starting Portfolio ($S_0$): 10,000 shares
Initial Share Price ($P_0$): KSh 30.90
Initial Year 1 Gross Dividend: KSh 2.00 per share
Withholding Tax (Tax Drag): 5% (Final tax for local individuals)
Initial Year 1 Net Dividend ($D_0$): KSh 1.90 per share
Reinvestment Execution Fee (Slippage): Estimated at 2.1% statutory broker transaction fees for entry.
Price Appreciation Assumptions: To isolate the pure mathematical impact of dividend reinvestment and dividend growth, the share price is modeled flat at KSh 30.90. This presents a conservative baseline; any market capital appreciation or price dips would dynamically alter the velocity of share accumulation.
The Three Dividend Growth Scenarios
Scenario A: Zero Dividend Growth (0% CAGR) — The dividend remains entirely static at KSh 2.00 gross (KSh 1.90 net) for all 10 years.
Scenario B: Moderate Growth (5% CAGR) — Reflects a stable, mature domestic market expansion where M-PESA and mobile data monetization increase predictably.
Scenario C: Aggressive Growth (10% CAGR) — Assumes highly successful scaling, where Ethiopia operations break even early and turn into a high-margin cash cow, alongside deep regional enterprise digitization.
Scenario A: Zero Dividend Growth (0% CAGR)
In this scenario, Safaricom pays a flat net dividend of KSh 1.90 every year. The only compounding variable is the organic expansion of the share count base.
Year 1: 10,000 shares generate a net dividend of KSh 19,000. Factoring in standard brokerage entry friction, this buys 599 new shares, bringing the total to 10,599 shares.
Year 5: Portfolio grows organically to 13,277 shares, pushing the annual net passive cash flow to KSh 25,226.
Year 10: The position scales to 17,734 shares, producing KSh 33,694 in annual net dividend income.
Verdict: Even without corporate dividend increases, the 5% tax-dragged yield expands your absolute equity position by 77.3% over a decade through systematic accumulation alone.
Scenario B: Moderate Dividend Growth (5% CAGR)
Here, SCOM increases its dividend by 5% annually, moving the net payout from KSh 1.90 in Year 1 to KSh 2.95 per share by Year 10.
10-Year Progression Tracker (5% Growth)
[Year 1: 10,000 Shrs | Net DPS: KSh 1.90] ➔ Net Payout: KSh 19,000 ➔ Reinvests into +599 Shrs
[Year 3: 11,274 Shrs | Net DPS: KSh 2.09] ➔ Net Payout: KSh 23,618 ➔ Reinvests into +746 Shrs
[Year 5: 12,836 Shrs | Net DPS: KSh 2.31] ➔ Net Payout: KSh 29,650 ➔ Reinvests into +937 Shrs
[Year 7: 14,769 Shrs | Net DPS: KSh 2.55] ➔ Net Payout: KSh 37,595 ➔ Reinvests into +1,188 Shrs
[Year 10: 22,652 Shrs | Net DPS: KSh 2.95] ➔ Net Payout: KSh 67,614 ➔ Reinvests into +2,136 Shrs
The Velocity Effect: By Year 10, the combination of a larger base ownership pool and higher underlying corporate payouts means your portfolio is printing KSh 67,614 in net annual dividends—more than triple the starting cash generation of Year 1.
Scenario C: Aggressive Dividend Growth (10% CAGR)
This scenario models Safaricom effectively doubling its dividend payout capacity over a multi-year horizon as its massive infrastructural capital expenditures in regional markets taper down. The net dividend transitions from KSh 1.90 in Year 1 to KSh 4.48 per share in Year 10.
Year 1 to 5 Acceleration: By the end of Year 5, your position climbs to 13,767 shares. Because the net dividend has increased to KSh 2.78 per share, the annual net payout hits KSh 38,290, buying you 1,209 free shares in a single compounding window.
The Year 10 Ultimate Terminal State: By Year 10, the portfolio reaches 29,510 shares. This represents an increase of nearly 200% more shares than your initial block without putting in any new out-of-pocket savings.
The Income Engine: In Year 10 alone, your net dividend income scales to KSh 132,159. At a constant stock value, this single-year distribution can automatically purchase 4,176 additional SCOM shares.
Critical Tactical Observations for Your Spreadsheets
The Tax Drag Reality Check: While the 5% local withholding tax is highly favorable compared to international capital gains or income tax regimes, it removes KSh 0.10 from every KSh 2.00 distributed. Over 10 years in the 10% growth scenario, this minor leak prevents the purchase of approximately 850 additional shares.
Friction and Batching: When managing small or medium-sized positions, manual execution forces you to deal with brokerage minimum commission fees (e.g., standard NSE broker minimums of KSh 100 per ticket). To achieve the high efficiency modeled in these scenarios, avoid running tiny buy orders. Combine your distributed dividend cash with regular monthly contributions to clear minimal brokerage floor charges cleanly.
The Reinvestment Premium: The real magic here is entirely dependent on keeping execution emotionless. In a typical market, price volatility means you will occasionally reinvest at KSh 26.00 (accelerating share acquisition) and sometimes at KSh 34.00 (decelerating it). Over a long macro loop, this averages out to a powerful structural dollar-cost averaging machine.