
CONFIDENTIAL EXECUTIVE BRIEFING
This strategic analysis and recovery framework is prepared exclusively for Chief Executive Officers, Board Directors, and Senior Bank Executives navigating the H1 2026 interest rate easing cycle.
Table of Contents
Executive Summary
SECTION 1: The H1 2026 Pivot — Asset Recovery as the New Frontier of Profitability
SECTION 2: The NIM Squeeze — Transmission Mechanics & Regulatory Tightening
SECTION 3: The Macro Benchmark — Asset Quality Across Bank Tiers & Regulatory Capital Pressures
SECTION 4: The NPL Landscape — Decoding Sectoral Concentration & Balance Sheet Transmission
SECTION 5: Tier-1 Peer Analysis — Asset Quality & Recovery Velocity
SECTION 6: The Buy-Side Playbook — Institutional Evaluation Criteria for H1 2026
Executive Summary
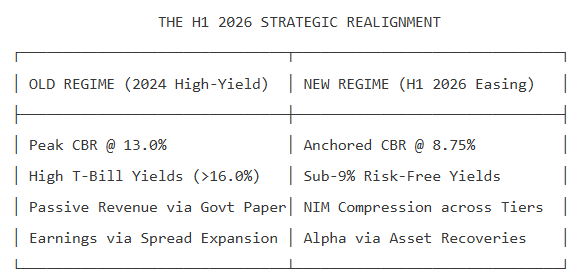
As the Kenyan banking sector transitions through the H1 2026 reporting window, the macroeconomic regime undergirding commercial bank profitability has fundamentally changed. The Central Bank of Kenya’s (CBK) monetary easing cycle—which brought the Central Bank Rate (CBR) down to 8.75% and pushed short-term Treasury bill yields into sub-9% territory—has permanently ended the era of high-yield, passive risk-free returns.
Net Interest Margins (NIMs) are undergoing structural compression as floating-rate corporate assets reprice downward at a significantly faster velocity than sticky, fixed-term liabilities. In this low-spread environment, traditional top-line loan expansion can no longer mask balance sheet inefficiencies or absorb heavy impairment charges.
Key Strategic Takeaways for C-Suite & Institutional Allocators
Asset Recovery as “New Interest Income”: With lending spreads capped under mandatory KESONIA-anchored risk-based pricing, bottom-line expansion and Return on Equity (ROE) alpha will be driven by bad debt recoveries, specific provision write-backs, and Stage 2 to Stage 1 loan migrations rather than gross volume growth.
The High-Coverage Dividend: Banks carrying deep specific provision buffers (>65%–74%) against legacy Stage 3 defaults are unlocking direct, cash-backed P&L accretion. Aggressive legal workouts (e.g., Equity’s court-cleared Riverside Mews liquidation) and debt-for-land regularisation (e.g., KCB’s Portland Cement Athi River titling framework) are generating substantial pre-tax write-back gains.
Execution Velocity Over Passive Provisioning: The H1 2026 earnings season marks a clear operational divide between proactive lenders unbundling distressed corporate holdings and passive institutions taking continued impairment hits. Lenders that compress their Cost of Risk (CoR) toward sub-1.5% are converting operating income straight into distributable shareholder capital.
Structural Capital Realities: Elevated systemic NPL ratios (15.4%–15.6%) combined with the CBK’s phased recapitalization mandate (climbing to KSh 5 Billion by late 2026 and KSh 10 Billion by 2029) will accelerate defensive M&A and capital raises among Tier-3 lenders lacking the balance sheet flexibility to absorb heavy write-offs.

SECTION 1: The H1 2026 Pivot — Asset Recovery as the New Frontier of Profitability
The Easing Paradigm Shift
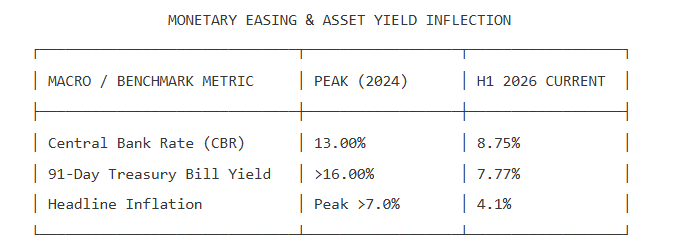
As the Kenyan banking sector enters the H1 2026 reporting cycle, the macroeconomic regime undergirding bank profitability has undergone a fundamental transformation. The high-interest environment of 2024—defined by a peak Central Bank Rate (CBR) of 13.0%—has officially dissolved. Driven by headline inflation moderating to ~4.1% in late 2025, the Central Bank of Kenya (CBK) executed a sustained monetary easing cycle, lowering the CBR to 9.0% by December 2025 and cutting it further to 8.75% in February 2026.
This rate-cutting cycle has effectively brought an end to the “lazy banking” era. Yields on short-term risk-free instruments have plummeted in tandem, with 91-day Treasury bill yields falling into sub-8% territory (7.77% at year-end 2025). Commercial lenders can no longer rely on passive, high-yielding government paper or wide nominal spreads to deliver earnings growth.
The Core Thesis: Asset Recovery as “New Interest Income”
In this low-yield environment, top-line loan growth can no longer cover balance sheet inefficiencies or heavy credit impairment charges. Net Interest Margins (NIMs) face structural compression across all bank tiers. Consequently, market outperformance in H1 2026 will be dictated by a single operational lever: asset recovery and Non-Performing Loan (NPL) workout velocity.
While full-year 2025 results signaled a broader stabilization in asset quality—pulling overall industry gross NPLs down from a peak of 17.1% to 15.4%—the H1 2026 reporting season will expose a sharp divergence between lenders relying on passive provisioning and those executing aggressive credit workouts.
The Boardlot Take: For institutional allocators, the H1 2026 earnings reports must be evaluated through a precise lens: How much of the bottom line was protected or expanded by credit write-backs and bad-debt recoveries? As net interest spreads narrow, credit workout capability has become the primary engine of Return on Equity (ROE) expansion, positive earnings surprises, and equity alpha.

SECTION 2: The NIM Squeeze — Transmission Mechanics & Regulatory Tightening
The Mechanics of Margin Compression
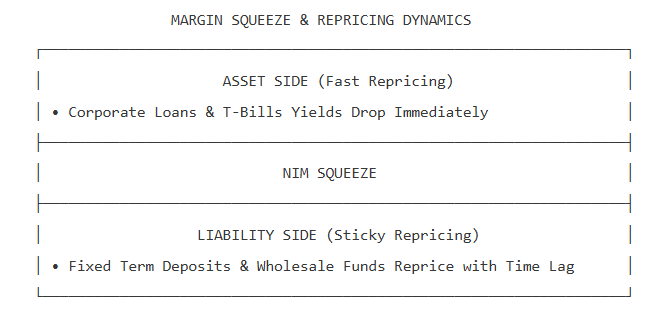
The primary structural challenge facing commercial bank C-suites in H1 2026 is the asymmetric repricing speed between asset yields and liability costs:
Fast-Repricing Assets: Floating-rate corporate loans, commercial paper, and short-dated government securities reprice downward almost immediately as benchmark rates fall.
Sticky-Cost Liabilities: Fixed-term deposits and wholesale funding reprice with a lag, creating temporary margin squeeze before interest expense relief materializes.
Market leaders have explicitly adjusted their forward guidance to reflect this margin squeeze. KCB Group has projected its full-year 2026 NIMs to compress to between 7.2% and 7.8% (down from higher historical baselines). While select peers like Co-operative Bank sustained strong margins through FY2025 (10.1%) via aggressive loan repricing, the sector-wide trend for 2026 points to structural margin stabilization at lower levels.
Regulatory Transmission: The KESONIA Risk-Based Mandate
The structural squeeze on margins is further amplified by regulatory compliance frameworks enforced by the CBK. As of February 2026, commercial banks have fully transitioned all existing variable-rate loan portfolios to the Revised Risk-Based Credit Pricing Model.
Under this mandatory regime:
Transparent Reference Anchoring: All commercial lending rates must be explicitly anchored to either the Kenya Shilling Overnight Interbank Average (KESONIA) or the Central Bank Rate (CBR), plus a contractually defined risk premium ($K$).
Elimination of Arbitrary Spreads: Lenders can no longer adjust internal base lending rates arbitrarily to shield interest income from declining benchmark yields.
Enhanced Spread Transparency: Borrowers receive full visibility into the risk-premium component (K), restricting a bank’s ability to inflate spreads without explicit risk justification.

Strategic Implication for Bank C-Suites & Allocators
With risk-free yields trending down, margin spreads capped by KESONIA benchmarks, and top-line interest income slowing, the traditional volume-driven model of banking profitability is cooling.
For bank executives and board audit/risk committees, sustaining ROE now requires aggressive Risk-Weighted Asset (RWA) optimization, operational cost control, and rapid NPL workouts. For institutional buy-side analysts, stock picking in H1 2026 requires shifting focus away from gross loan book growth and toward the balance sheets demonstrating the fastest Cost of Risk (CoR) reduction and highest provision write-back potential.
SECTION 3: The Macro Benchmark — Asset Quality Across Bank Tiers & Regulatory Capital Pressures
3.1 Sector Baseline: Tracing the Macro Default Trajectory
An examination of regulatory supervision frameworks—specifically CBK Bank Supervision Annual Reports and Financial Sector Stability updates—reveals that the credit default cycle in Kenya reached its point of structural inflection through late 2024 into FY2025.
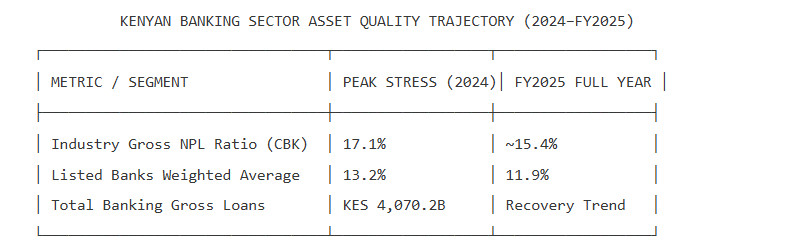
At the height of macro stress in late 2024, systemic default rates peaked, pushing the total banking sector gross NPL ratio to 17.1% as total gross loans contracted by 2.7% to KES 4,070.2 billion. This asset quality decay was driven by historic rate hikes, pending public sector bills, and severe consumer disposable income compression.
However, aggressive balance sheet housecleaning, heightened write-offs, and targeted loan restructurings executed throughout FY2025 succeeded in bending the default curve:
Industry-Wide Recovery: Overall banking sector gross NPL ratios retreated to ~15.4% by year-end FY2025.
Listed Lenders Outperformance: The weighted average NPL ratio for listed commercial banks on the Nairobi Securities Exchange (NSE) pulled back 1.3 percentage points to 11.9% in FY2025 (down from 13.2% in FY2024).
3.2 The CBK Minimum Core Capital Glidepath: Strategic Implications
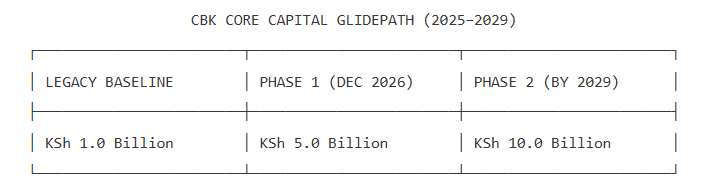
Superimposed on this asset quality recovery is the Central Bank of Kenya’s mandatory capital upgrade cycle. The CBK’s revised prudential framework requires commercial banks to systematically scale their minimum core capital bases:
Phase 1 Mandate: Core capital floor raised from KSh 1.0 Billion to KSh 5.0 Billion by December 2026.
Phase 2 Mandate: Core capital floor raised to KSh 10.0 Billion by 2029.
National Treasury Cabinet Secretary John Mbadi has proposed extending the compliance deadline for commercial banks to meet the KSh 10 billion minimum core capital threshold to December 31, 2032. The proposal eliminates the rigid annual capital milestones previously mandated, offering lenders greater flexibility to raise capital through capital injections, mergers, or strategic partnerships without eroding shareholder value or disrupting operations. By overriding the Central Bank of Kenya's strict earlier timeline, the extended window gives banks room to deploy resources toward private-sector lending, potentially accelerating credit growth beyond 14%.
Strategic Impact on Bank Peer Groups:
Tier-1 Absolute Comfort: Tier-1 leaders maintain core capital buffers exceeding KSh 50B–KSh 100B, placing them far clear of statutory limits.
Tier-2 Consolidation Catalyst: Mid-tier institutions close to the KSh 5B mark are forced to retain earnings aggressively or seek strategic equity injection, accelerating sub-sector M&A.
Tier-3 Capital Erosion Paradox: For small and specialized lenders carrying elevated NPL books, required credit loss provisions directly erode the equity base needed to meet the impending KSh 5.0B December 2026 deadline.
3.3 Tier Dynamics & Balance Sheet Risk Profiles
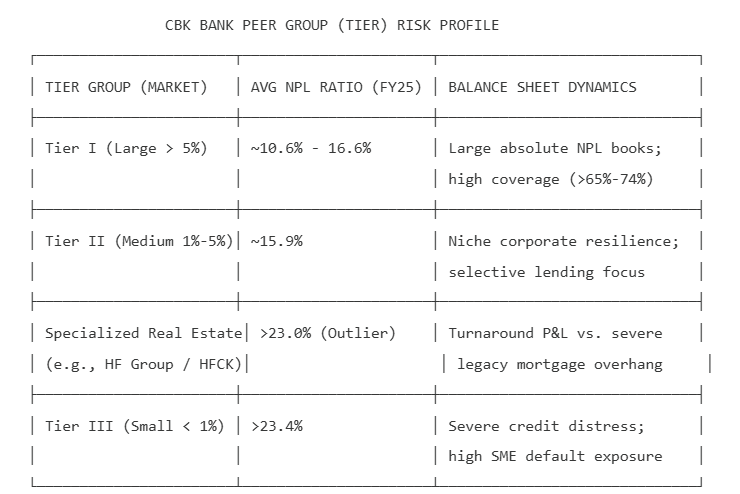
While macro indicators show structural recovery, supervisory data highlights a sharp divergence when analyzing asset quality across bank market share tiers and specialized business models:
1. Tier I (Large Banks): High Nominal NPLs Shielded by Deep Capital Buffers
Tier I lenders hold the dominant market share of systemic credit and, consequently, the largest nominal volume of non-performing loans (e.g., KCB’s gross NPL book stood at KES 211.8B in FY25 despite its ratio improving to 16.2%). However, Tier I institutions maintain strong structural buffers:
High Provision Coverage: Comprehensive specific provision coverage ratios ranging between 65% and 74%.
Capital Adequacy Reserves: Total Capital to Risk-Weighted Assets ratios comfortably exceed 19.6% (well clear of the statutory 14.5% floor and future core capital thresholds).
Earnings Torque: Heavily provisioned balance sheets mean successful workouts release provisions directly back into pre-tax profits, creating substantial upside potential for H1 2026 earnings.
2. Tier II (Medium Banks): Relative Stability Below Industry Baseline
Tier II lenders demonstrated relative stability, maintaining an average NPL ratio hovering near 15.9%. Benefiting from tighter underwriting focus, selective corporate client lists, and less exposure to uncollateralized mass-market retail debt, Tier II balance sheets avoided extreme default spikes.
3. Specialized Mid-Tier Warning: The HF Group (HFCK) Legacy Real Estate Overhang
While Tier-1 lenders have compressed headline NPL ratios toward 10%–16%, select specialized mid-tier institutions continue to carry outlier credit risk. HF Group (HFCK) presents a critical diagnostic case for buy-side allocators evaluating turnaround claims:
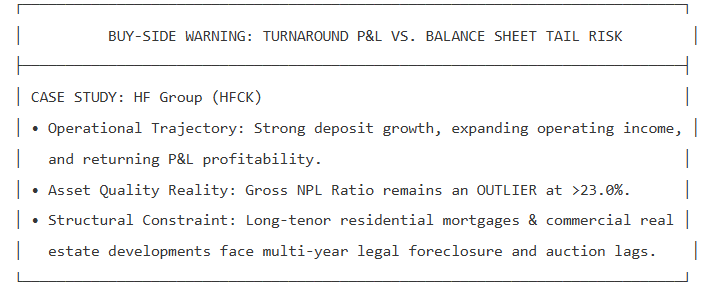
The Headline Operational Turnaround: HFCK has demonstrated clear operating momentum, expanding its deposit franchise, lowering cost-of-funds, and returning operating profitability to positive territory.
The Balance Sheet Outlier: Despite operational recovery, HFCK’s gross NPL ratio remains severely elevated at >23%, standing as a clear outlier relative to listed peers (11.9%) and the broader industry (15.4%).
The Real Estate Trap: Because HFCK’s legacy book is heavily weighted toward long-tenor residential mortgages and commercial real estate, resolution velocity is inherently constrained by lengthy legal foreclosures, community resistance, and slow secondary property absorption.
Institutional Caution: Investors must not confuse short-term P&L turnarounds with structural credit risk elimination. Until HFCK’s legacy real estate defaults are aggressively liquidated or written down, its capital base remains vulnerable to unexpected impairment spikes—creating an equity drag as the CBK’s Dec 2026 core capital requirement deadline approaches.
4. Tier III (Small Banks): Structural Credit Stress & Capital Squeeze
Tier III institutions continue to face severe credit quality pressure, with average NPL ratios remaining stubbornly elevated above 23.4%:
SME Default Concentration: Heavily exposed to distressed Micro, Small, and Medium Enterprises (MSMEs) and secondary trade suppliers.
Limited Workout Leverage: Unlike Tier I peers, Tier III banks lack the capital flexibility to absorb massive write-offs or enforce prolonged legal recoveries.
The Double Squeeze: High provisioning requirements erode the exact equity buffers needed to hit the CBK’s mandatory KSh 5.0B core capital threshold by year-end 2026, making defensive consolidation or equity dilution unavoidable.
Regulatory Reprieve: Extending the Timeline, Not Solvency
While the National Treasury and the Central Bank of Kenya (CBK) have provided temporary relief by granting extended, phased timelines for lenders to meet the steep KES 10 billion statutory minimum core capital threshold, investors should not mistake regulatory leniency for fundamental balance sheet health. Extending the compliance runway merely buys tier-3 and undercapitalized lenders extra time—it does not fix deteriorating asset quality, thin interest margins, or limited organic capital generation. Without aggressive equity injections, structural bailouts, or forced consolidation, additional time only postpones an inevitable reckoning for institutions unable to generate core revenue in a tightening market.

SECTION 4: The NPL Landscape — Decoding Sectoral Concentration & Balance Sheet Transmission
As commercial banks transition into the mid-2026 reporting cycle, the sectoral concentration of Non-Performing Loans (NPLs) detailed in CBK Bank Supervision frameworks provides the critical baseline for evaluating where balance sheet strain originates—and where the most valuable write-backs will occur.
At the height of the recent credit cycle, systemic defaults expanded total gross NPLs to Ksh 697.3 billion. However, this deterioration was highly asymmetrical. Rather than being distributed evenly across the real economy, default risk was heavily concentrated in specific commercial corridors.
1. The “Big Four” Contributors: Identifying the Core Stress Vectors
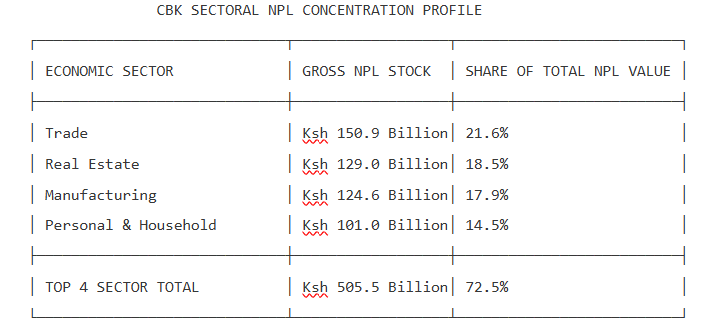
According to CBK supervisory data, a staggering 72.5% of the total value of non-performing loans was generated by just four economic sectors:
Wholesale & Retail Trade (21.6% / Ksh 150.9B): The single largest contributor to systemic default stock. Driven by squeezed consumer disposable income and extended supply chain payment terms, trade finance facilities experienced the highest rate of fast-moving default migration.
Real Estate (18.5% / Ksh 129.0B): Characterized by lengthy legal timelines for security realization, elevated construction debt, and slow property absorption rates. While highly collateralized, real estate bad debts carry high capital-carrying costs for lenders under IFRS 9 staging rules.
Manufacturing (17.9% / Ksh 124.6B): Impacted by elevated operational input costs, currency depreciation pressures during early 2024, and working capital constraints.
Personal & Household (14.5% / Ksh 101.0B): While accounting for the vast majority of individual borrower accounts (92.6% of total loan accounts), individual consumer default values remain small relative to corporate books.
2. MSME Vulnerability & The Stage 2-to-Stage 3 Migration
Beyond headline sector labels, the Micro, Small, and Medium Enterprise (MSME) segment represents a major transmission vector for credit risk. Total MSME NPLs surged to Ksh 149.8 billion—representing 19.1% of the entire MSME loan portfolio and accounting for over 21.5% of all banking sector bad debts.
Equally critical for forward-looking H1 2026 performance was loan migration within default categories. While “Substandard” loan classifications showed early signs of stabilization, “Doubtful” facilities expanded by 18.0%. This shift signaled that distressed debt was sinking deeper into default territory, forcing lenders to build heavy specific provisions—setting up the exact balance sheet conditions required for massive write-backs during the current easing cycle.
3. The Analytical Link to Individual Bank Performance
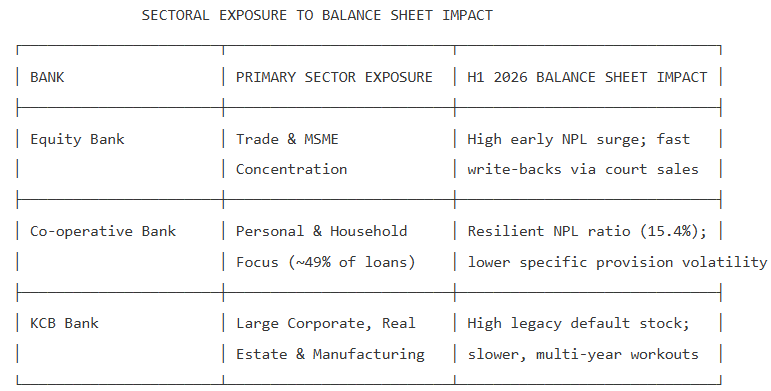
For buy-side portfolio managers and banking executives, this sectoral concentration map directly explains the divergence in Tier 1 performance:
Portfolio Asset Quality Resilience: Lenders with heavy structural tilts toward Personal & Household debt (e.g., Co-operative Bank at 49% of gross loans) escaped the worst of the corporate default wave, maintaining lower baseline NPL ratios.
Write-Back Earnings Torque: Lenders that took aggressive specific provisions against high-value Real Estate and Corporate Trade defaults in 2024 (e.g., Equity Bank) are now positioned to unlock direct P&L recoveries as large collateral auctions and legal restructuring settlements finalize in H1 2026.
Legacy Clearance Lag: Lenders carrying deep exposure to delayed infrastructure and Manufacturing/Construction projects (e.g., KCB Group) face lengthier workout timelines, requiring dedicated “credit war rooms” to clear legacy books.

Section 5: Tier-1 Peer Analysis — Asset Quality & Recovery Velocity
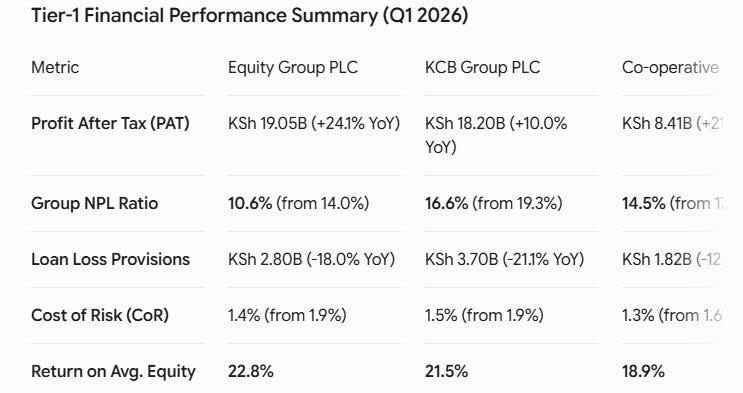
The first-quarter 2026 financial results across Kenya’s Tier-1 banking sector mark a clear operational divide. While the commencement of the monetary easing cycle—highlighted by a cumulative 200 bps reduction in the Central Bank Rate (CBR) to 8.75%—provided systematic relief to interest expenses, bottom-line expansion was overwhelmingly dictated by balance sheet resolution strategies.
Lenders that aggressively resolved non-performing loans (NPLs) through active enforcement and receivership asset monetization unlocked significant provisioning write-backs and earnings torque. Conversely, institutions relying on passive loan restructuring or taking heightened impairment charges experienced constrained return on equity (ROE) momentum.

5.1 Equity Group: The “Legally Uncompromising” Workout Strategy
Equity Group delivered the sector’s most pronounced recovery trajectory in Q1 2026, posting a 24.1% YoY surge in Group Profit After Tax to KSh 19.05 billion. Driven by a 20.8% net profit increase in its primary Kenya unit (KSh 10.31 billion), the performance was underpinned by a 340 bps collapse in its group NPL ratio down to 10.6%.
Rather than relying on passive balance sheet write-offs or continuous loan reschedulings, Equity executed an aggressive workout strategy utilizing court-backed security realisations and corporate receivership restructuring.
Case Study A: Security Realization in Commercial Real Estate — Riverside Mews / Chase Bank HQ (KSh 1.3B)
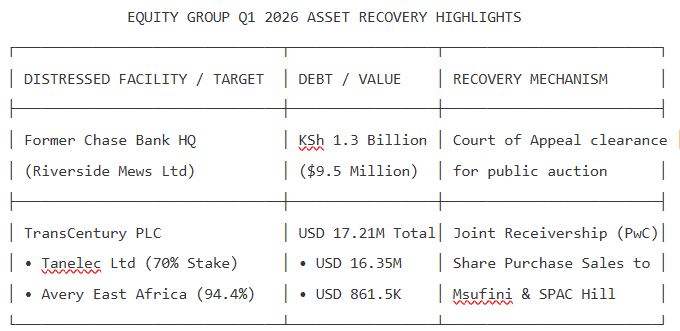
The Context: In March 2026, the Court of Appeal dismissed an application attempting to block Equity Bank from selling the Riverside Office Block (the former Chase Bank Headquarters) in Nairobi. The lender moved to realize security for a $9.5 million (KSh 1.3 billion) non-performing loan extended to Riverside Mews Limited dating back to 2012.
The Operational Execution: The resolution demonstrates Equity’s willingness to navigate multi-year litigation processes to enforce primary debentures on prime commercial real estate.
P&L & Capital Impact: Because the legacy exposure carried high specific provision coverage (Stage 3), recovery proceeds from the court-cleared public auction directly feed into earnings as provision write-backs. Concurrently, extinguishing the non-performing asset removes a heavy Risk-Weighted Asset (RWA) penalty, restoring regulatory capital headroom.
Case Study B: Corporate Restructuring & Subsidiary Unbundling — TransCentury PLC Receivership
The Context: Following the June 2023 placement of TransCentury PLC under receivership over defaulted debts, Joint Receivers Muniu Thoithi and George Weru of PwC executed structured divestments of operating subsidiaries to clear creditor obligations.
The Operational Execution: The receivers unbundled TransCentury’s key operating assets rather than attempting a forced liquidation of the holding entity:
Tanelec Limited: Secured a Share Purchase Agreement to transfer TransCentury’s 70% shareholding interest (and related debts) to Msufini (T) Limited for USD 16.35 million.
Avery East Africa Limited (AEA): Concluded a Share Purchase Agreement to sell 679,720 ordinary shares (a 94.4% stake) to SPAC Hill Capital Limited for USD 861,538.
P&L & Capital Impact: Aggregating USD 17.21 million (~KSh 2.2 billion) in realisations across operating units, these transactions enable direct debt settlement to Equity Bank, releasing specific impairments directly into core earnings.

5.2 KCB Group: Debt-for-Land Surrender & Squatter Regularisation (Athi River Playbook)
KCB Group reported a 10.0% YoY rise in net profit to KSh 18.20 billion, supported by an NPL ratio improvement from 19.3% to 16.6%. Alongside the structural relief provided by the sale of National Bank of Kenya (NBK), KCB executed a unique recovery strategy on a massive KSh 6.6 billion defaulted loan extended to East African Portland Cement Company (EAPCC).
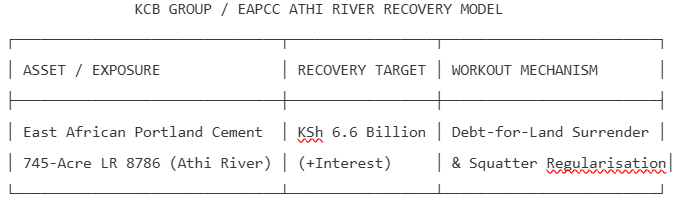
Case Study C: Resolving Complex Distressed Real Estate via Land Regularisation — Athi River (KSh 6.6B)
The Context: EAPCC owed KCB Bank KSh 6.6 billion, an exposure that was accumulating roughly KSh 600 million in interest annually and threatening the cement maker with asset foreclosure. To prevent liquidation, EAPCC surrendered 745 acres of land (LR 8786) in Mavoko/Athi River directly to KCB as a debt settlement deal.
The Operational Execution: Realizing that a standard forced public auction of squatter-occupied land would face severe community resistance, political backlash, and prolonged legal delays, KCB pioneered a regularisation recovery framework:
Direct Titling & Sub-division: KCB took title ownership and contracted professional property advisors (Antidote Agencies and Tysons Ltd) to manage plot subdivisions, valuation, and allocation.
First Right of Refusal to Occupants: Existing settlers/squatters were given priority to buy and formalise their plots at structured rates (with an administrative regularisation baseline starting at KSh 200,000 per plot).
Structured Titling Pipeline: KCB implemented a clear payment pipeline—from deposit submission and sale agreements to final title issuance—converting informal land occupancy into cash proceeds.
P&L & Capital Impact: By turning an encumbered, non-performing KSh 6.6B corporate loan into a retail land monetisation drive, KCB converted a stagnant Stage 3 asset into steady cash flow recoveries. This directly fed provision write-backs into KCB’s P&L and compressed its Cost of Risk down to 1.5%.
While KCB Group’s debt-for-land agreement with East African Portland Cement Company represents a positive step toward clearing legacy defaults, the practical realization of these returns will be a prolonged exercise. In a real estate market hampered by tight liquidity and reduced purchasing power, monetizing 745 acres through fragmented plot sales to individual buyers is inherently slow. This delay is further compounded by Athi River’s existing saturation of residential and industrial land listings. Consequently, investors should anticipate an extended resolution timeline—potentially up to 60 months—before this non-performing asset is fully converted into realized cash flow and balance sheet recoveries.
5.3 Q1 2026 Earnings Analysis: Margin Compression and FX Contraction At Stanbic and Absa
The First Quarter 2026 earnings for Absa Bank Kenya and Stanbic Bank Kenya highlight a challenging shift in market dynamics. A combination of aggressive rate cuts by the Central Bank of Kenya—which sent asset yields lower—and reduced foreign exchange volatility exposed structural vulnerabilities in both lenders’ earnings models.
Absa Bank Kenya: Topline Erosion and Expanding Cost Ratios
Absa felt the full force of margin pressure, reporting a 13.8% drop in profit after tax to KES 5.31 billion. Net Interest Margin (NIM) compressed sharply from 10.47% to 8.92% as asset yields dropped faster than funding costs could reprice. Compounding this yield squeeze was a 17.9% slump in foreign exchange trading income (falling to KES 1.26 billion). With operating expenses rising 2.4%, Absa’s cost-to-income ratio deteriorated from 44.3% to 48.9%, pointing to an operational efficiency model struggling under lower-margin conditions.
Stanbic Bank Kenya: Paper-Thin Growth Masks Topline Softness
While Stanbic managed a modest 5.5% increase in net profit to KES 3.52 billion, the quality of this earnings growth raises serious questions. Despite expanding its balance sheet past the half-trillion mark (+22.6% in assets), non-funded income plummeted 13.8% to KES 2.38 billion, hit hard by declining FX trading margins and sluggish transaction activity. In reality, Stanbic’s profit line was artificial: pre-tax growth was largely engineered through aggressive provision cuts (loan loss provisions were slashed by 59.1%) and strict expense freezes rather than robust core revenue generation.
Both cases demonstrate that as the high-interest-rate environment unwinds and FX trading windfalls vanish, balance sheet growth alone is failing to shield Tier-1 lenders from margin erosion.
5.4 Peer Comparisons: Co-operative Bank and NCBA
Co-operative Bank: Efficiency & Defensive Organic Curing
Co-operative Bank delivered a 21.3% YoY jump in net profit to KSh 8.41 billion, driven by strong operational efficiency (Cost-to-Income Ratio of 44.3%) and an NPL ratio reduction from 17.0% to 14.5%. Co-op Bank’s strategy relied on early-stage digital loan monitoring and working capital restructurings for MSMEs, allowing organic loan book curing without resorting to prolonged legal liquidations.
NCBA Group: Conservative Provisioning Strategy
NCBA recorded an 8.8% YoY net profit increase to KSh 5.96 billion. While headline NPLs improved from 12.2% to 11.2%, NCBA took a conservative stance by increasing credit loss provisions by 56.7% YoY to KSh 2.54 billion. This pushed its Cost of Risk up to 2.1%, temporarily weighing on net profit margin expansion despite top-line revenue growing 15%.
While NCBA Group’s core exposure in vehicle asset financing offers a relatively straightforward path to liquidation through straightforward repossessions and auction sales, its legacy corporate book presents a far more complex challenge. The lender remains heavily entangled in protracted court battles over large-scale, distressed logistics exposures—most notably its multi-billion shilling facilities extended to Multiple Hauliers. Although these legacy defaults are fully provisioned for on paper, the lingering litigation prevents timely capital recovery, ties up restructuring resources, and will continue to serve as a persistent structural drag on the bank’s balance sheet performance throughout 2026.

5.5 C-Suite & Executive Takeaways
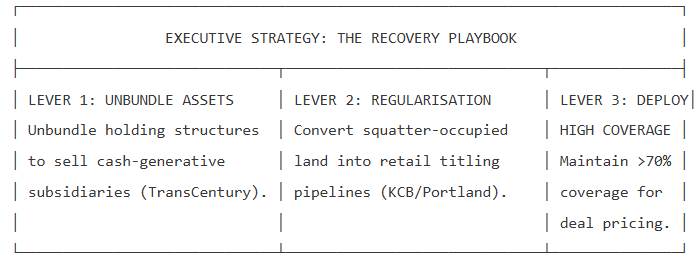
Unbundle Holding Structures in Corporate Defaults: In complex corporate exposures, attempting to sell a parent holding company often leads to heavy haircuts. As demonstrated in the TransCentury receivership, unbundling and selling operating, cash-generating subsidiaries (e.g., Tanelec and AEA) to strategic buyers maximizes cash recovery velocity and creditor payout.
Utilize Squatter Regularisation for Encumbered Land: Liquidating large, squatter-occupied land holdings via public auctions often fails due to social and legal friction. KCB’s execution on the EAPCC land (LR 8786) demonstrates that accepting a debt-for-land transfer and monetizing it through occupant regularisation creates a structured, high-yield cash recovery pipeline.
Exhaust Appellate Remedies for Commercial Collateral: Real estate collateral backing legacy NPLs frequently faces protracted court injunctions. Equity’s clearance on the Riverside Mews / Chase Bank HQ property proves that pursuing primary debentures through higher court rulings is critical to unlocking provision write-backs and clearing high-risk-weighted assets.
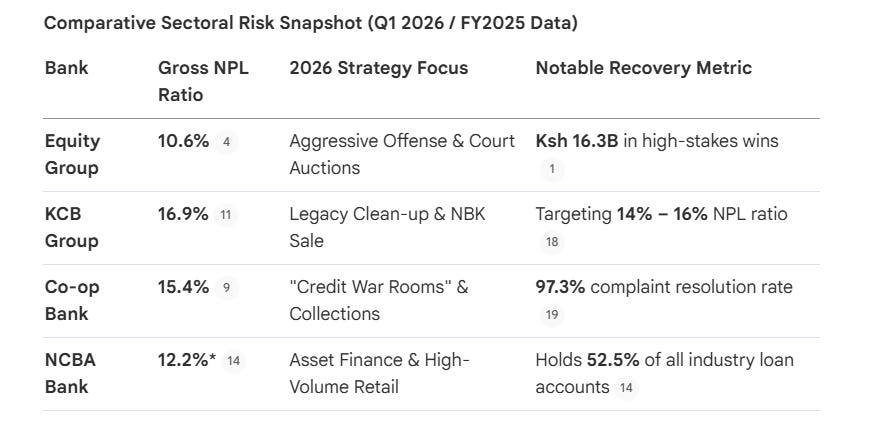
*Dec 2024 Industry Data
In summary, while NCBA and Co-op Bank provide stability, the “impressive results” for Equity in early 2026—and potentially for KCB by mid-year—are being carved out of aggressive asset recoveries. As interest income growth slows, the ability to turn “Watch” list clients back into “Performing” ones, or to successfully auction high-value assets like the Chase Bank HQ, has become the ultimate competitive advantage.

SECTION 6: The Buy-Side Playbook — Institutional Evaluation Criteria for H1 2026
As commercial banks release their half-year statements, institutional allocators and equity research analysts must cut through top-line accounting metrics to evaluate true operational recovery.
Evaluating bank profitability solely on nominal credit growth or gross interest income in a declining rate environment is a value trap. In an easing cycle where Net Interest Margins (NIMs) face structural compression, market outperformance is dictated by balance sheet resolution velocity and provision release quality.
To identify equity alpha and protect fixed-income yield in H1 2026, buy-side managers should evaluate Tier-1 balance sheets using a three-part analytical framework:
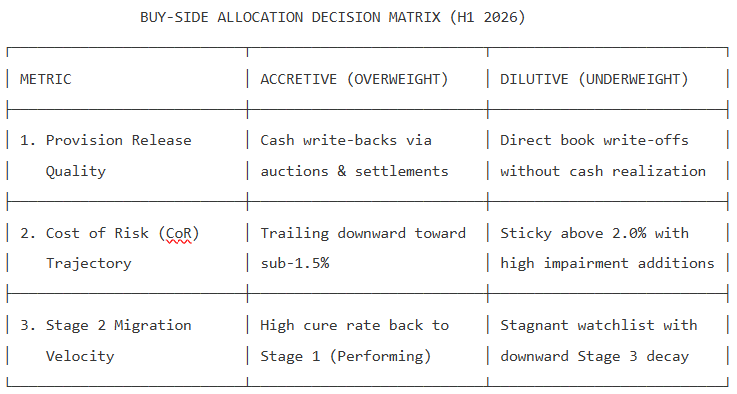
6.1 Specific Provisioning Coverage: Cash Recovery vs. Book Value Dilution
When a lender reports a drop in its headline NPL ratio, institutional investors must scrutinize the underlying accounting mechanism driving the improvement:
High-Quality Resolution (Cash-Backed Write-Backs): Look for NPL reductions driven by genuine cash collections, court-cleared collateral liquidations (e.g., Equity’s Riverside Mews auction), or structured debt-for-land titling (e.g., KCB’s Portland Cement regularisation). Because these Stage 3 assets carry high specific provisioning (>70%), cash realization releases provisions straight back into pre-tax earnings (P\&L), expanding Net Profit After Tax and Return on Equity (ROE).
Low-Quality Resolution (Accounting Write-Offs): If an NPL ratio drops purely because a bank wrote off fully provisioned loans against its equity buffers without actual cash realization, headline asset quality improves on paper, but net book value is diluted with zero P&L accretion.
Buy-Side Action: Overweight banks with high specific coverage ratios (>65%–74%) that demonstrate active legal and receivership workout desks. In a low-NIM regime, every shilling recovered on a fully provisioned asset delivers pure, non-interest earnings torque.
6.2 Cost of Risk (CoR) Compression: The True Metric of Earnings Momentum
In a monetary easing cycle, top-line net interest income growth cools. Consequently, the primary engine of bottom-line profit surprise is the contraction of credit loss expenses on the income statement.
Cost of Risk (CoR) = Total Annualized Credit Impairment Charges\Average Gross Loan Book
The Compression Threshold: Institutions that compress their CoR below 1.5% (such as Equity Group at 1.4% and KCB Group at 1.5%) are successfully converting operating income into distributable shareholder profits.
The Impairment Drag: Conversely, lenders maintaining a elevated CoR above 2.0% (such as NCBA at 2.1%) are absorbing significant earnings drag from ongoing provisioning, capping immediate ROE expansion despite solid top-line revenue.
Buy-Side Action: Target banks where trailing 12-month Cost of Risk is sloping downward. A 50 bps reduction in CoR provides a far larger boost to bottom-line EPS than a 50 bps expansion in gross loan volume under current KESONIA-capped lending spreads.
6.3 Stage 2 to Stage 1 Migration Velocity: The Forward NPL Pipeline
Headline NPL ratios (Stage 3) reflect historical credit default. To judge forward-looking credit health, buy-side analysts must track Stage 2 (Watchlist) migration dynamics.
The Curing Dividend: As benchmark rates fall by 200+ bps, debt-service coverage ratios (DSCR) for corporate and MSME borrowers improve. Lenders with sophisticated digital monitoring and active restructuring desks will show a high percentage of Stage 2 loans “curing” back into Stage 1 (Performing). This reduces required general provisions and signals a dry pipeline for future NPL formation.
The Default Decay Risk: If Stage 2 balances remain stagnant or slip downward into Stage 3 despite lower borrowing costs, it indicates structural solvency issues rather than liquidity stress within the bank’s borrower base.
Buy-Side Action: Reallocate capital toward lenders demonstrating a shrinking Stage 2 balance sheet share. A shrinking watchlist combined with high NPL coverage creates the ultimate setup for multi-quarter earnings outperformance and dividend growth throughout H2 2026.

Boardlot Africa is a premier financial intelligence and corporate governance publication dedicated to unpacking the mechanics of capital, market strategies, and structural shifts across East Africa’s corporate landscape. By bridging the gap between raw economic data and actionable market intelligence, we deliver deep-dive research, independent corporate analysis, and policy insights designed for institutional investors, boardrooms, and sharp market observers.
Get in Touch
Email: boardlot.research@gmail.com
Phone: +254 753 133 901
Substack: Subscribe to Boardlot Africa
X (Twitter): BoardLotSultan